Fig. C.1
Download original image
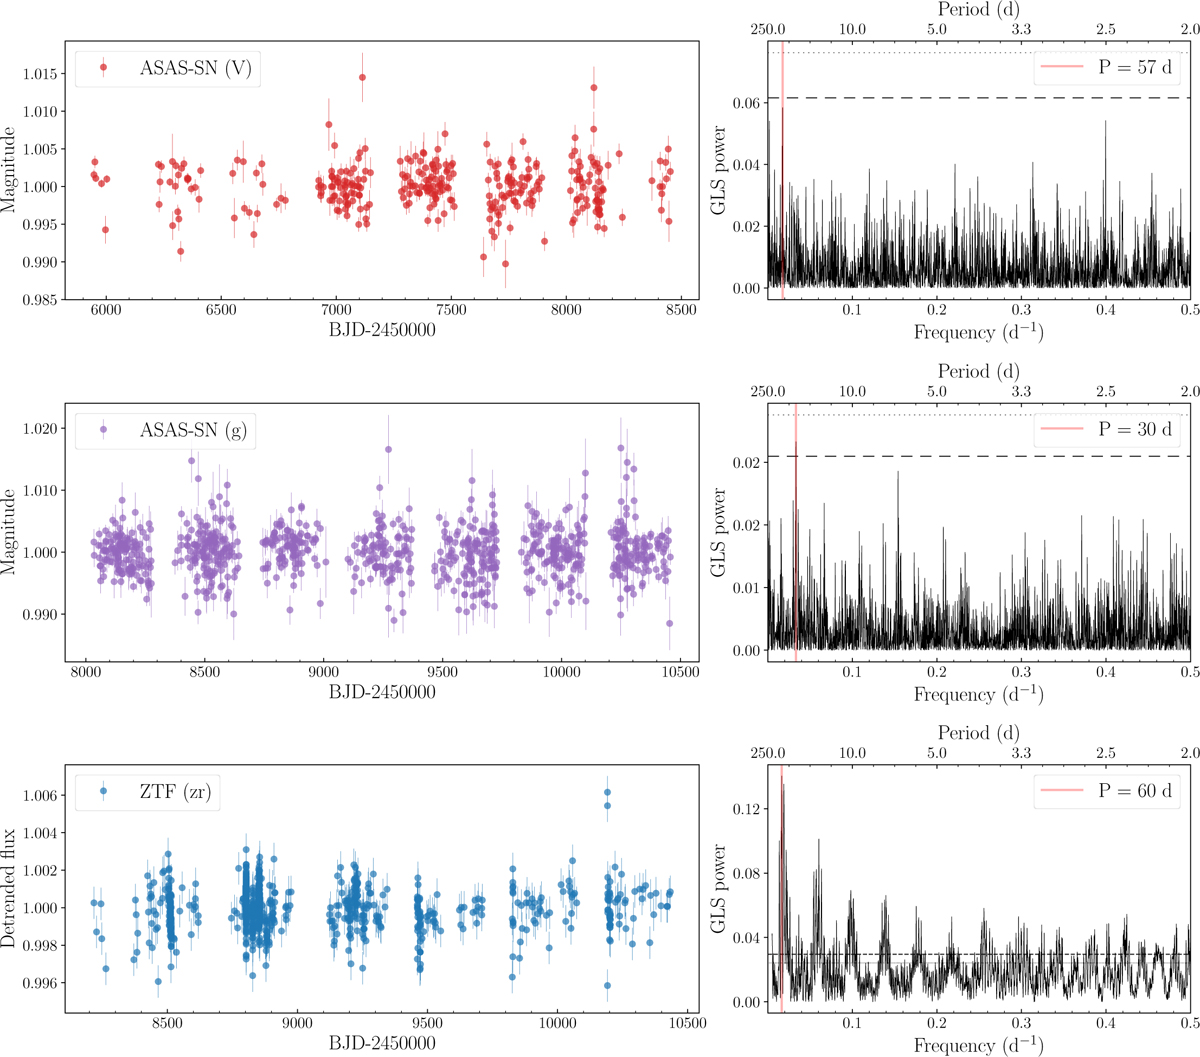
ASAS-SN (top and middle) and ZTF photometry (bottom) of TOI-521. The light curves are linearly detrended to remove the effect of the high proper motions of the star. The right panel of each plot shows the GLS periodogram, highlighting the 1% (dashed line) and 10% (dotted line) FAP levels. The most significant frequency is marked with a red vertical line. None of the ASAS-SN peaks is highly significant, while for ZTF many peaks and aliases are identified, probably due to the irregular sampling.
Current usage metrics show cumulative count of Article Views (full-text article views including HTML views, PDF and ePub downloads, according to the available data) and Abstracts Views on Vision4Press platform.
Data correspond to usage on the plateform after 2015. The current usage metrics is available 48-96 hours after online publication and is updated daily on week days.
Initial download of the metrics may take a while.