Fig. D.1
Download original image
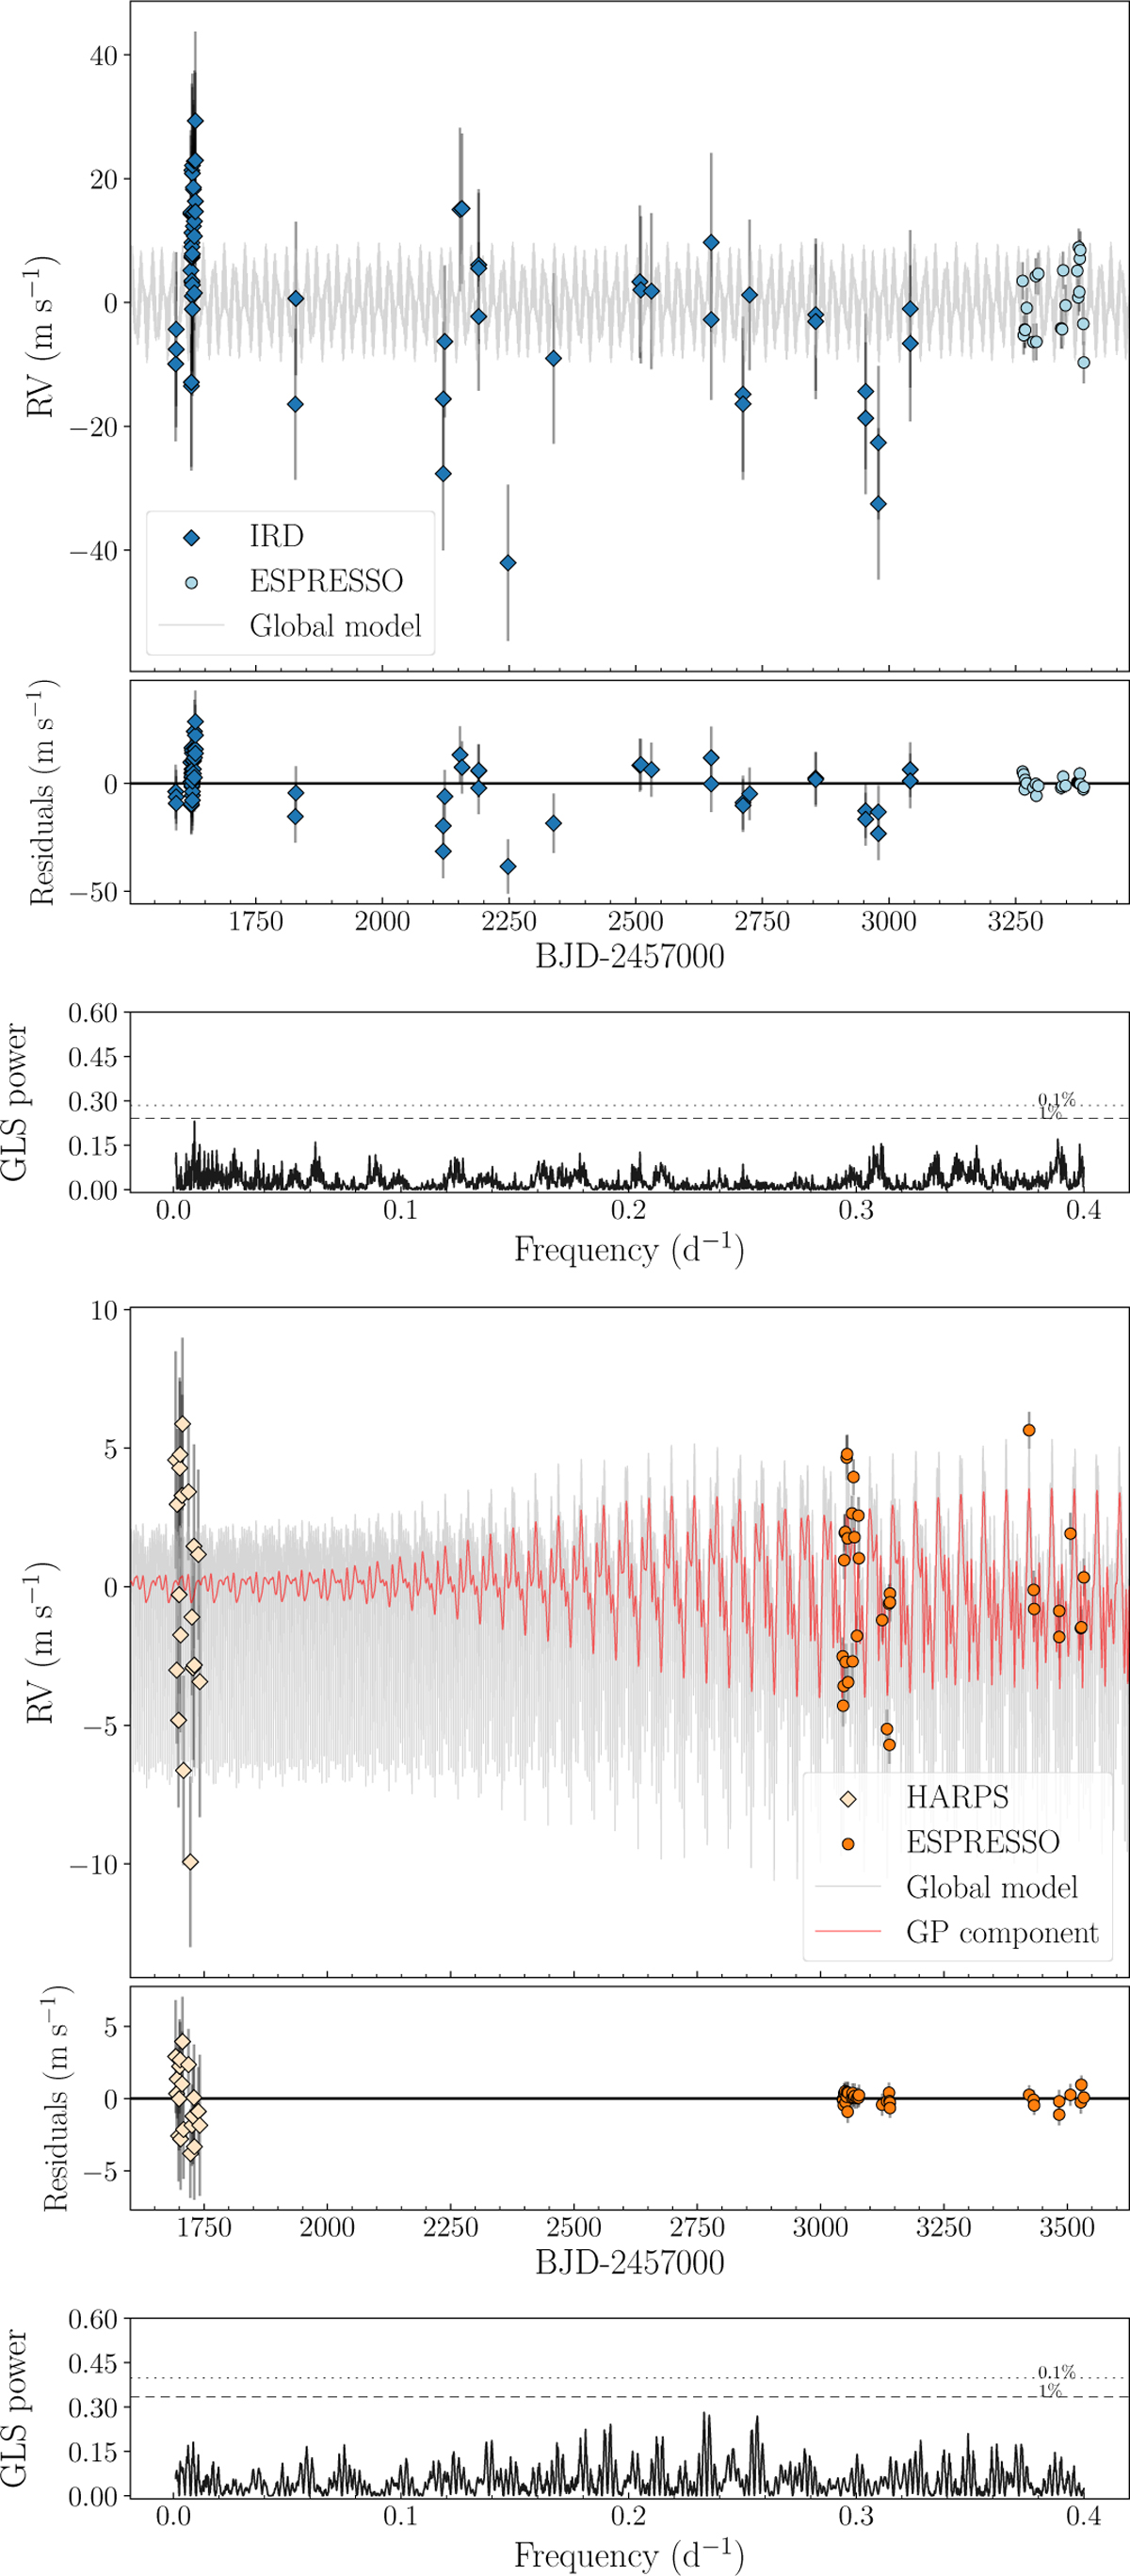
TOI-521 (top) and TOI-912 (bottom) RV model with residuals from the joint fit. The global model and the GP component are shown with solid grey and red lines, respectively. For each time series, the bottom panel shows the GLS periodogram of the residuals, with the 0.1% and 1% FAP levels shown as horizontal dotted and dashed lines, respectively.
Current usage metrics show cumulative count of Article Views (full-text article views including HTML views, PDF and ePub downloads, according to the available data) and Abstracts Views on Vision4Press platform.
Data correspond to usage on the plateform after 2015. The current usage metrics is available 48-96 hours after online publication and is updated daily on week days.
Initial download of the metrics may take a while.