Fig. 4
Download original image
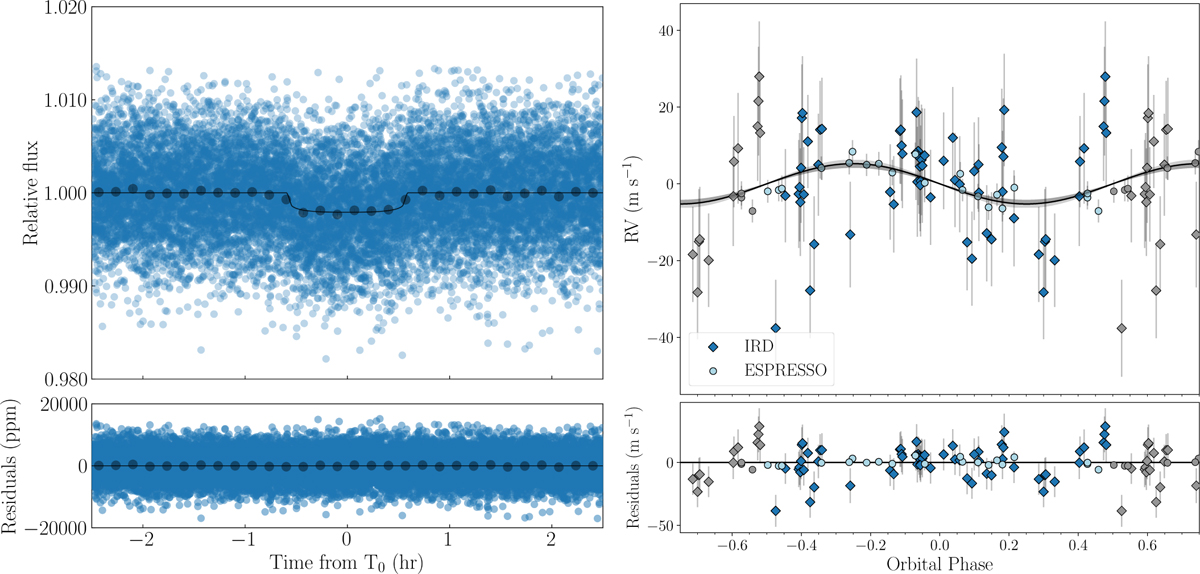
Phase-folded TESS light curve (left) and RVs (right) of TOI-521 b from the joint photometric and RV analysis. The bottom panels show the model residuals. The best-fitting model is plotted as a solid black line. In the transit plot, the black dots show the data binned over 15 min. In the RV plot, the error bars include the jitter term, added in quadrature to the nominal error, and the shaded grey area highlights the ±1σ region.
Current usage metrics show cumulative count of Article Views (full-text article views including HTML views, PDF and ePub downloads, according to the available data) and Abstracts Views on Vision4Press platform.
Data correspond to usage on the plateform after 2015. The current usage metrics is available 48-96 hours after online publication and is updated daily on week days.
Initial download of the metrics may take a while.