Fig. 7
Download original image
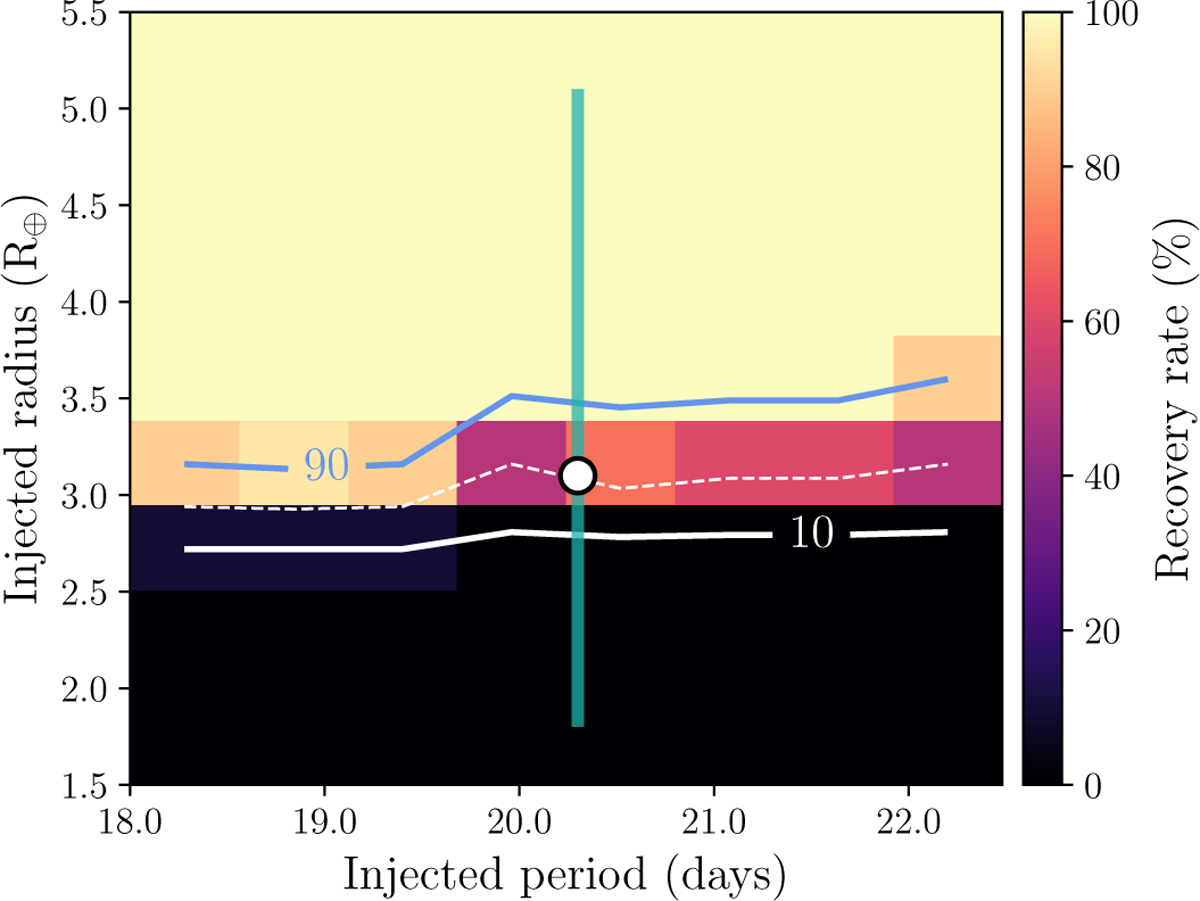
Results of the injection-recovery experiment performed with MATRIX to assess the detectability of the candidate TOI-521 c. The colour scale represents recovery rates, where bright yellow indicates high recovery and dark purple or black indicates low recovery. The solid blue line marks the 90% recovery contour, the dashed white line indicates the 50% one, and the solid white line shows 10%. The white dot marks the nominal value for TOI-521 c derived using spright, and the solid green line denotes the 95% credible interval of the most probable radius distribution.
Current usage metrics show cumulative count of Article Views (full-text article views including HTML views, PDF and ePub downloads, according to the available data) and Abstracts Views on Vision4Press platform.
Data correspond to usage on the plateform after 2015. The current usage metrics is available 48-96 hours after online publication and is updated daily on week days.
Initial download of the metrics may take a while.