Fig. 2
Download original image
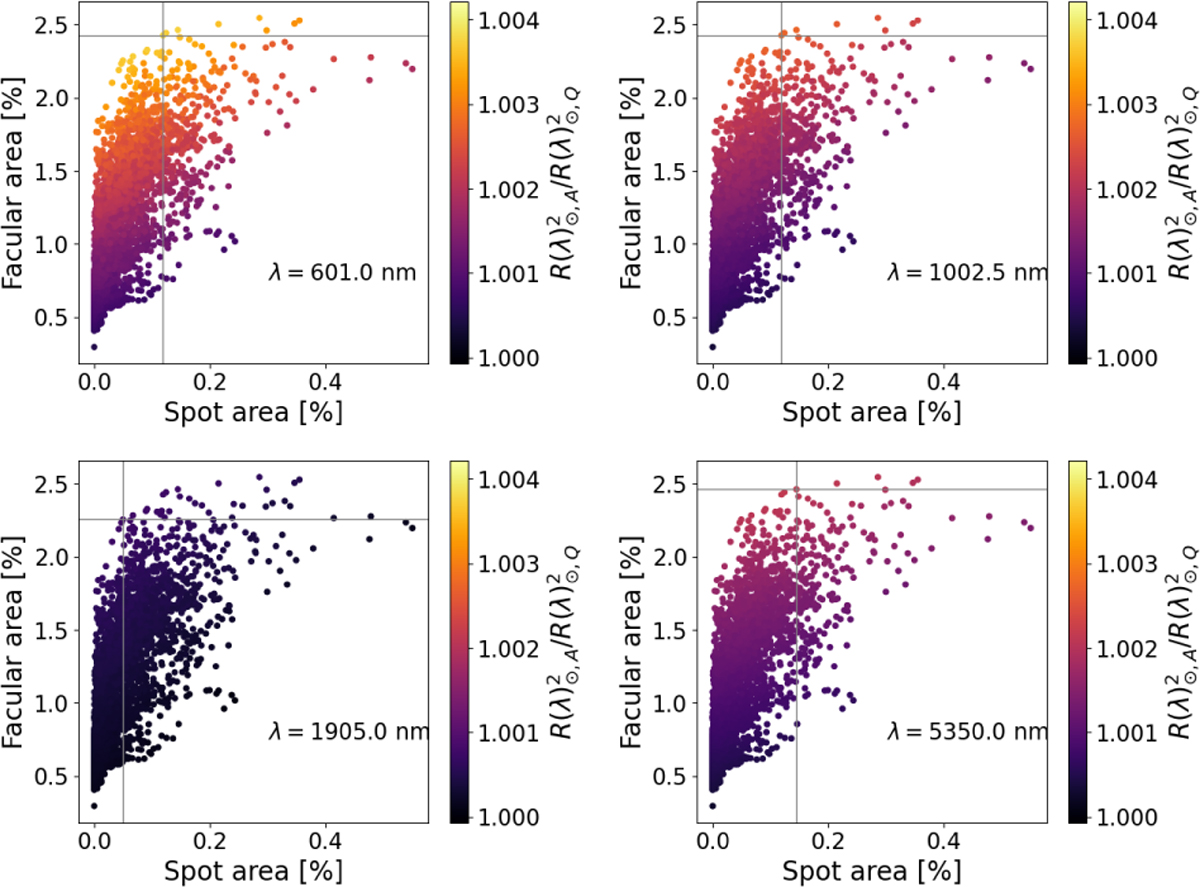
Activity-induced apparent radius (as indicated by the colours) as a function of spot area coverage for selected wavelengths. The grey lines indicate the position of the maximum in the apparent radius for each of the wavelengths shown. We note that the average facular area is 1% and the mean spot area is 0.04%. An animated version of this figure is available online.
Current usage metrics show cumulative count of Article Views (full-text article views including HTML views, PDF and ePub downloads, according to the available data) and Abstracts Views on Vision4Press platform.
Data correspond to usage on the plateform after 2015. The current usage metrics is available 48-96 hours after online publication and is updated daily on week days.
Initial download of the metrics may take a while.