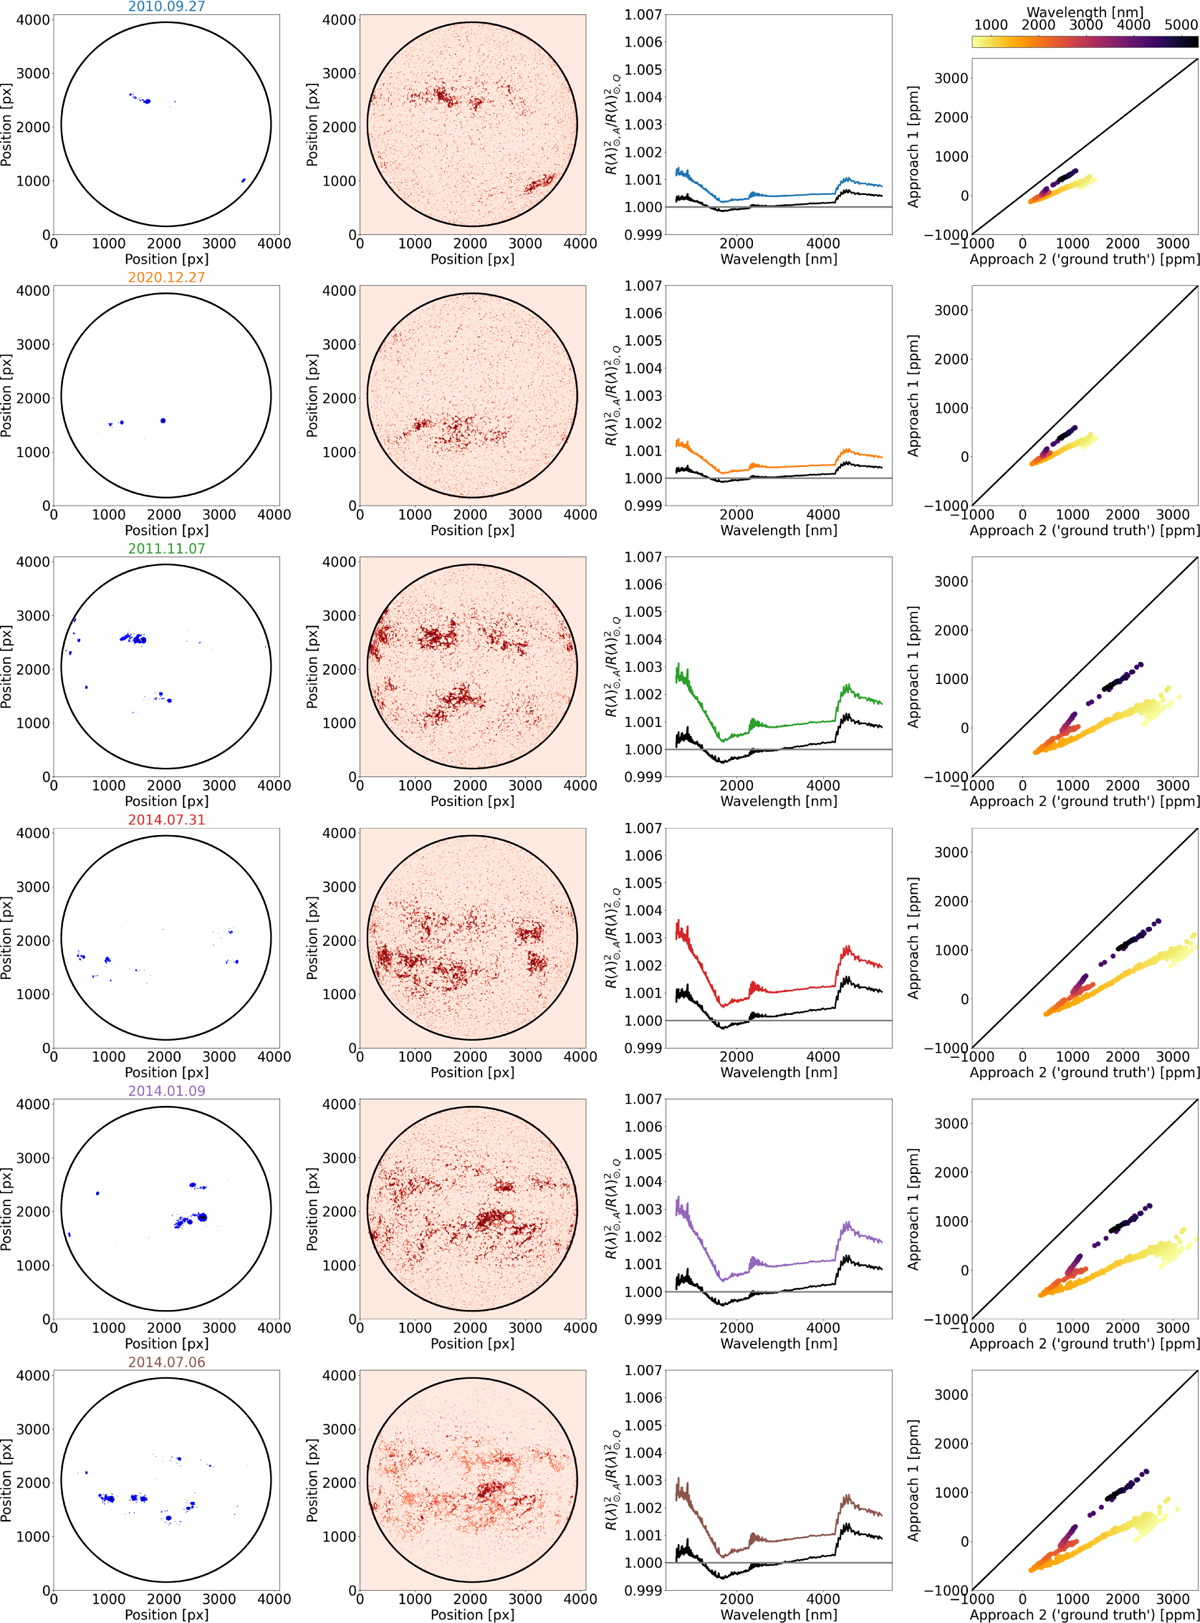
Fig. 3
Download original image
Closer look at the different approaches presented in Fig. 1 by taking 6 days presented in Table 1, with their spot distribution in the first column and the faculae distribution in the second column, the apparent radius for approach 1 (black solid lines) and approach 2 (coloured solid lines) in column three, and scatterplots of the apparent radius as a function of wavelength (column four). We refer to the text for details of why those dates were chosen.
Current usage metrics show cumulative count of Article Views (full-text article views including HTML views, PDF and ePub downloads, according to the available data) and Abstracts Views on Vision4Press platform.
Data correspond to usage on the plateform after 2015. The current usage metrics is available 48-96 hours after online publication and is updated daily on week days.
Initial download of the metrics may take a while.