Fig. 1.
Download original image
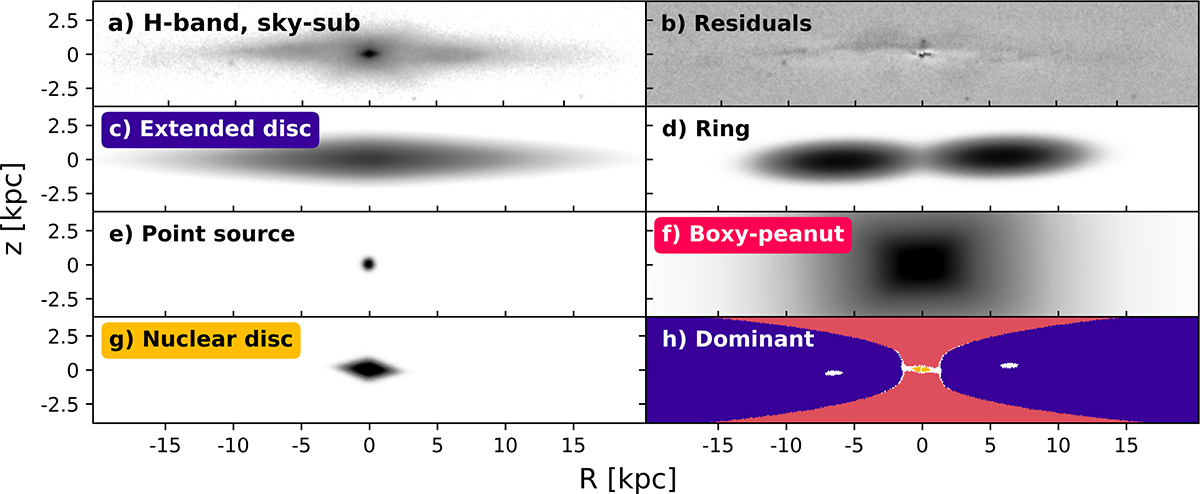
Components of the image decomposition of PGC 044931. Panel (a): sky-subtracted H-band VIRCAM image (arcsinh scaled). Panel (b): residual map after subtraction of the five components (linear scale). Panels (c) to (g): the five components fit with IMFIT (arcsinh scale, limits altered to show maximum structure). Panel (h): spatial extent of the three dominant components. The extended disc is shown in purple, and the boxy-peanut bulge is in pink. The nuclear disc (yellow) is very small and only dominates near the centre.
Current usage metrics show cumulative count of Article Views (full-text article views including HTML views, PDF and ePub downloads, according to the available data) and Abstracts Views on Vision4Press platform.
Data correspond to usage on the plateform after 2015. The current usage metrics is available 48-96 hours after online publication and is updated daily on week days.
Initial download of the metrics may take a while.