| Issue |
A&A
Volume 705, January 2026
|
|
|---|---|---|
| Article Number | A1 | |
| Number of page(s) | 4 | |
| Section | Extragalactic astronomy | |
| DOI | https://doi.org/10.1051/0004-6361/202557327 | |
| Published online | 19 December 2025 | |
The GECKOS survey: The formation history of a barred galaxy via structural decomposition and spatially resolved spectroscopy
1
European Southern Observatory, Karl-Schwarzschild-Straße 2, Garching 85748, Germany
2
Centre for Extragalactic Astronomy, Department of Physics, Durham University, South Road, Durham DH1 3LE, UK
3
Institute for Computational Cosmology, Department of Physics, Durham University, South Road, Durham DH1 3LE, UK
4
European Southern Observatory, Alonso de Córdova 3107, Casilla 19, Santiago 19001, Chile
5
Astrophysics Research Institute, Liverpool John Moores University, 146 Brownlow Hill, Liverpool L3 5RF, UK
6
Department of Physics, University of Oxford, Denys Wilkinson Building, Keble Road, Oxford OX1 3RH, UK
7
Cardiff Hub for Astrophysics Research & Technology, School of Physics & Astronomy, Cardiff University, Queens Buildings, Cardiff CF24 3AA, UK
8
Centre for Astrophysics and Supercomputing, Swinburne University of Technology, PO Box 218 Hawthorn VIC 3122, Australia
9
Homer L. Dodge Department of Physics & Astronomy, University of Oklahoma, 440 W. Brooks St., Norman, OK 73019, USA
10
School of Physics, University of New South Wales, NSW 2052, Australia
11
International Centre for Radio Astronomy Research (ICRAR), The University of Western Australia, M468, 35 Stirling Highway, Crawley, WA 6009, Australia
★ Corresponding author: This email address is being protected from spambots. You need JavaScript enabled to view it.
Received:
19
September
2025
Accepted:
1
November
2025
Abstract
Disentangling the (co-)evolution of individual galaxy structural components remains a difficult task, owing to the inability to cleanly isolate light from spatially overlapping components. In this pilot study of PGC 044931, observed as part of the GECKOS survey, we utilised a VIRCAM H-band image to decompose the galaxy into five photometric components, three of which dominate by contributing more than 50% of light in specific regions, namely, a main disc, a boxy-peanut bulge, and a nuclear disc. When mapping the photometric decompositions onto MUSE observations, we found remarkably good separation in stellar kinematic space. All three structures occupy unique locations in the parameter space of the ratio of the light-weighted stellar line-of-sight mean velocity and velocity dispersion (V★/σ★) and the high-order stellar skew (h3). These clear and distinct kinematic behaviours allowed us to make inferences about the formation histories of the individual components from observations of the mean stellar ages and metallicities of the three components. A clear story emerged: the main disc was built over a sustained and extended star formation phase, possibly partly fuelled by gas from a low-metallicity reservoir. Early on, that disc formed a bar that buckled and subsequently formed a nuclear disc in multiple and enriched star-formation episodes. This result is an example of how careful photometric decompositions combined with spatially well-resolved stellar kinematic information can help separate age-metallicity relations of different components and therefore disentangle the formation history of a galaxy. The results of this pilot study can be extended to a differential study of all GECKOS survey galaxies to assert the true diversity of Milky Way-like galaxies.
Key words: galaxies: bulges / galaxies: evolution / galaxies: general / galaxies: kinematics and dynamics / galaxies: stellar content / galaxies: structure
© The Authors 2025
 Open Access article, published by EDP Sciences, under the terms of the Creative Commons Attribution License (https://creativecommons.org/licenses/by/4.0), which permits unrestricted use, distribution, and reproduction in any medium, provided the original work is properly cited.
This article is published in open access under the Subscribe to Open model. This email address is being protected from spambots. You need JavaScript enabled to view it. to support open access publication.
1. Introduction
An enduring challenge for galaxy evolution studies is extricating the (co-)evolution of individual stellar structures from integrated galaxy light. Previous statistical photometric and spectroscopic decompositions on hundreds of parsec-scale images (e.g. Lange et al. 2016; Häußler et al. 2022) and kiloparsec-scale integral-field spectroscopic (IFS) datasets (e.g. Johnston et al. 2017; Tabor et al. 2019; Oh et al. 2020; Pak et al. 2021) have generally divided galaxies into two components: a (de Vaucouleurs) bulge and an (exponential) disc. The studies undertaking this work were often limited by constraints on signal-to-noise ratio (S/N) and spatial resolution, coupled with a need for automation. While statistical in nature, the techniques used often did not account for stellar bars, other non-axisymmetric structures, nor the possibility of a non-dispersion-supported central structure.
Added galactic complexity reveals itself with improved spatial resolution and careful, supervised image decompositions. For example, fitting multiple discy components to a galaxy surface brightness profile can often yield a better fit to a galaxy’s light profile than a simple Sérsic two-component decomposition (Gadotti et al. 2015). The era of highly resolved (tens to hundreds of parsecs) IFS galaxy surveys has revealed clear signatures of discrete dynamical structures in stellar kinematic maps that can be assigned to features such as nuclear discs1, stellar bars, boxy or peanut bulges, and axisymmetric discs (e.g. Gadotti et al. 2020; Fraser-McKelvie et al. 2025). Importantly, dynamically cold central structures such as nuclear discs have been resolved in multiple galaxies (e.g. Seidel et al. 2015; Corsini et al. 2016; Guérou et al. 2016; Sarzi et al. 2016; Pinna et al. 2019; Martig et al. 2021, though we note that in not all of these instances do we expect these discs to be bar-built) and are vital in determining bar ages (e.g. de Sá-Freitas et al. 2023, 2025). These results build upon previous theoretical (Bureau & Athanassoula 2005) and observational (Chung & Bureau 2004) 1D results linking stellar kinematics along a galaxy’s photometric major axis to stellar structures such as bars and nuclear discs.
The importance of separating galaxies into their constituent components arises from (i) the hypothesis that these structures formed and evolved via different mechanisms and (ii) that some components (e.g. stellar bars) may be driving galaxy evolution through internal secular processes (e.g. Athanassoula 2013; Sellwood 2014). Therefore, techniques to cleanly separate light and thus isolate meaningful structures corresponding to different orbital families (while noting that some structures will always be co-spatial regardless of galaxy projection) are paramount. The result of such work will be the ability to infer the star formation histories of individual dynamical stellar structures and understand their formation pathways.
This paper aims to combine the power of detailed photometric structural decompositions with the information provided by the stellar kinematic and stellar population measurements afforded by IFS observations. In this GECKOS2 pilot study of the boxy-peanut bulge galaxy PGC 044931, we specifically attempt to determine whether photometric decompositions coupled with IFS measurements can provide meaningful information on the assembly history of individual galaxy structures, and we attempt to understand the overall galaxy assembly history.
2. PGC 044931: A buckled barred galaxy
PGC 044931 is an edge-on disc galaxy at a distance of 50.7 Mpc (Tully et al. 2023). The galaxy possesses a clear boxy-peanut bulge (as seen from unsharp masked imaging in e.g. Fraser-McKelvie et al. 2025) and is therefore presumed to host a buckled stellar bar (Bureau et al. 2006). Chung & Bureau (2004) confirmed this hypothesis via stellar kinematic measurements of the projected light-weighted line-of-sight mean V★, σ★, and high order moment h3. They reported a characteristic anti-correlation, correlation, and then anti-correlation of h3 versus V★/σ★, as expected for a dynamically cold nuclear disc (the size of which was measured from 2D IFS observations to be r = 0.71 kpc; Fraser-McKelvie et al. 2025), a stellar bar, and an underlying axisymmetric stellar disc, respectively. The galaxy shows no photometric nor kinematic sign of the presence of a classical bulge.
2.1. GECKOS data
PGC 044931 was observed with the Very Large Telescope’s Multi-Unit Spectroscopic Explorer (MUSE) as part of the GECKOS survey (van de Sande et al. 2024) via two pointings, the first of which was centred on the bulge, and the second a disc offset to the north-west. The raw data were reduced using the ESO MUSE pipeline routines, as packaged by PYMUSEPIPE version 2.23.4 (Emsellem et al. 2022), and analysed to produce stellar kinematic (V★, σ★, h3) and mean age and metallicity maps binned to an S/N of 100 using the NGIST pipeline (Fraser-McKelvie et al. 2025).
2.2. Photometric decomposition
Photometric decomposition was performed on an image from the Visible and Infrared Survey Telescope for Astronomy (VISTA), using the VISTA InfraRed CAMera (VIRCAM). The H-band 1.65-μm image obtained as part of the VISTA hemisphere survey (ESO Program 179.A-2010) with a seeing-limited spatial resolution of 0.8 arcsec (210 parsecs). IMFIT (Erwin et al. 2015) was employed to model the light profile of the galaxy by adding components until the fit no longer improved. The fit was optimised using the differential evolution algorithm, which minimises subjective choices, for example, by only requiring lower and upper limits for the fitted parameters from the user (Gadotti 2025). The best fit was found to include an extended edge-on disc, an edge-on ring, a central point source, a boxy-peanut bulge, and an edge-on nuclear disc. A flat sky component that corrects any residuals left from the background subtraction was also included.
Panel a of Fig. 1 shows the sky-subtracted H-band image (arcsinh scaled), and panel b shows the residual image after all components have been subtracted. The 2D light distribution of the five components are shown in panels c through g, while panel h shows the dominant component of each pixel, where the dominant component comprises more than 50% of the light of that pixel. Only three components ever dominate: the extended disc, the boxy-peanut bulge, and the nuclear disc. White regions correspond to areas in which no component contributes more than 50% of the light. These areas were not considered in the following analysis. We note that the grey contours delineating the spatial regions dominated by the boxy-peanut bulge and extended disc do not directly line up with the ‘X’ shape. We suspect that this discrepancy is due to the 50% threshold adopted when defining these regions, which is reflected in the increased metallicity of the extended disc data points with a lower dominance fraction seen in Fig. 3 (right). There is likely some contamination from the extended disc in this region.
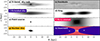 |
Fig. 1. Components of the image decomposition of PGC 044931. Panel (a): sky-subtracted H-band VIRCAM image (arcsinh scaled). Panel (b): residual map after subtraction of the five components (linear scale). Panels (c) to (g): the five components fit with IMFIT (arcsinh scale, limits altered to show maximum structure). Panel (h): spatial extent of the three dominant components. The extended disc is shown in purple, and the boxy-peanut bulge is in pink. The nuclear disc (yellow) is very small and only dominates near the centre. |
3. Results and discussion
3.1. Stellar kinematics
We mapped the dominant component of each VIRCAM pixel onto the Voronoi-binned GECKOS/MUSE stellar kinematic and stellar population maps using a method similar to Querejeta et al. (2021) and Martig et al. (2021). Maps of light-weighted V★, h3, stellar age, and stellar metallicity with the masking regions defined from the photometric decomposition are shown in Fig. 2. As predicted for non-axisymmetric (bar-like) orbits, the sign of h3 matches that of V★ within the boxy-peanut bulge region only.
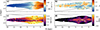 |
Fig. 2. Masking regions from Fig. 1h overlaid as grey contours on light-weighted stellar kinematic (a) V★, (b) h3, and population (c) age along with (d) metallicity maps of PGC 044931. White regions denote masked regions (e.g. due to foreground stars) or areas in which the spaxels did not reach the minimum continuum S/N threshold of 5. A distinctive metal-rich ‘X’ shape is present in the metallicity map. This feature has been seen in other galaxies (e.g. NGC 4710; Gonzalez et al. 2016) and is in agreement with simulations (e.g. Debattista et al. 2017; Fragkoudi et al. 2020). |
We then extracted the stellar kinematic and population information of each component. In Fig. 3 (left panel) we plot h3 as a function of V★/σ★ for each bin, coloured by the dominant component of each bin, with the opacity of the point representing the fractional dominance of the given component’s light in that region. All three components exhibit a distinct behaviour in this parameter space. The nuclear disc (yellow data points) stands out as a clear anti-correlation in h3 − V★/σ★ for |V★/σ★| < 2. This behaviour is expected to be the manifestation of the low-velocity tail of the line of sight velocity distribution, attributed to the presence of a decoupled, dynamically cold, rapidly rotating edge-on nuclear disc likely built by the bar (Chung & Bureau 2004). The boxy-peanut bulge (bar) structure (pink data points) shows a correlation between h3 and V★/σ★, which Bureau & Athanassoula (2005) attributed to the addition of elongated bar orbits (e.g. x1 and 4:1) to the line of sight velocity distribution, creating the tail of high-velocity material required for V★ and h3 to correlate. Finally, as expected, the extended disc shows an anti-correlation between h3 and V★/σ★ extending out to larger V★/σ★ and presumably to larger radii, where the disc is more rotation dominated.
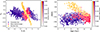 |
Fig. 3. Separation of the photometric components of PGC 044931 in stellar kinematic and stellar population space. Left: stellar h3 versus V★/σ★, with data points corresponding to Voronoi bins for which the majority of the bin is located in one of the photometric regions. The underlying extended disc, boxy-peanut bulge (bar), and nuclear disc show distinctly different behaviours in this parameter space, allowing us to confidently make inferences about their star formation histories. Right: mean light-weighted stellar metallicity versus stellar age. The nuclear disc is clearly separated from the bar and boxy-peanut bulge, and the boxy-peanut region is on average older and more metal rich than the underlying disc. The colour saturation indicates the fraction of light attributed to the given component in each bin. |
Clear separations and distinct behaviours in the kinematic parameter space are therefore present between the three photometric components, implying that a simple mapping of the dominant structures extracted from the 2D light distribution can satisfactorily translate to distinct kinematic components.
3.2. Stellar populations
We plot the distribution of light-weighted average age and metallicity for each of the three galaxy components (the extended disc, boxy-peanut bulge, and nuclear disc) in Fig. 3 (right panel). These three components again exhibit distinct behaviours in this parameter space, the division becoming even clearer in regions where a given component has greater dominance. While we did not compute the uncertainties in this work, similar analyses of MUSE observations have reported statistical uncertainties of ≈1 Gyr in age and 0.05 in [M/H] (e.g. Martig et al. 2021). The metallicity of the extended disc is similar to that of the boxy-peanut bulge, though spans a range of stellar ages and becomes slightly more metal poor for younger ages. The boxy-peanut bulge is almost exclusively old and comparatively metal poor, and the nuclear disc spans a range of average stellar ages and is more metal rich than any other region of the galaxy. The divergence of the nuclear disc’s age-metallicity relation from the main disc and boxy-peanut bulge occurs at ≈10 Gyr.
Putting the stellar population information together, we can speculate on an evolutionary scenario. Bars are known to build nuclear discs, which are fed by a protracted supply of cold gas fuelling ongoing star formation as the nuclear disc grows (e.g. Hawarden et al. 1986; Athanassoula 1992; Seo et al. 2019; Verwilghen et al. 2024). The measured ages and metallicities require that the nuclear disc of PGC 044931 formed more recently than the disc stars that comprise the bar (e.g. due to star formation in a small physical region that enriches the local area quickly, possibly through processes such as those described in Leaman et al. 2019). Given the clear offset in metallicity of the nuclear disc from ≈10 Gyr, we can infer that the nuclear disc must have formed around that time, and the bar must therefore be at least this old.
Stars map from the disc to the boxy-peanut bulge at the time of bar buckling, meaning that the stellar population of the boxy-peanut bulge should be representative of the disc at that time (e.g. Martinez-Valpuesta & Gerhard 2013; Fragkoudi et al. 2017). To first order, there should be no gas present in the boxy-peanut bulge and thus no further star formation should occur, and the underlying stellar population should remain old and metal poor. Finally, the extended disc may be the recipient of (near) pristine gas from a broader H I disc, the cosmic web, or gas-rich minor mergers, allowing ongoing star formation (and hence a range of measured stellar ages) without intensive enrichment of the nuclear disc region. Further work to characterise the age of the oldest stellar population in the nuclear disc (and thus infer the age of the bar; e.g. de Sá-Freitas et al. 2023, 2025) may confirm this scenario.
4. Summary and conclusions
In this work, we have presented an example of how careful and detailed photometric decompositions can identify multiple coherent stellar substructures that can be used to understand galaxy assembly history. Through the photometric decomposition of a VIRCAM H-band image of GECKOS galaxy PGC 044931, three components were found to dominate the stellar light distribution: an extended disc, a boxy-peanut bulge, and a nuclear disc. Mapping the photometric decomposition to GECKOS light-weighted stellar kinematic and stellar age and metallicity maps yielded clear separations between all three components in the kinematic and stellar population parameter spaces. From these decompositions, we propose a scenario in which a disc galaxy formed and a stellar bar buckled long ago. The bar grew a nuclear disc that was enriched via star formation that was fed by inflowing gas along the bar. The underlying disc exhibits ongoing star formation but little chemical enrichment, likely due to an ongoing supply of (near) pristine gas from an extended H I disc, the cosmic web, or minor mergers.
Complementary to recent efforts to combine stellar dynamics and population analyses (e.g. Poci et al. 2021; Ding et al. 2023), this pilot study paves the way for the use of careful photometric decompositions with highly spatially resolved IFS data to understand the assembly history of galactic components. The outcome of such efforts will be a better understanding of the build-up of galactic structures over cosmic time and the resultant influence of galactic structures on the overall evolution of the host galaxies.
Here we define a nuclear disc as a central disc (typically built by a bar) of radius 100 pc – 1 kpc (see review by Schultheis et al. 2025).
GECKOS: Generalising Edge-on galaxies and their Chemical bimodalities, Kinematics, and Outflows out to Solar environments.
Acknowledgments
Based on observations made with ESO telescopes at the La Silla Paranal Observatory under programme IDs 110.24AS and 179.A-2010. The authors wish to thank Evelyn Johnston and Boris Häußler for useful conversations related to the science of this work. Author contribution statement: this project was devised by AFM, with analysis completed by AFM, photometric decomposition performed by DAG, and science comments by the whole author list. AFM gratefully acknowledges the sponsorship provided by the European Southern Observatory through a research fellowship. DAG is supported by STFC grant ST/X001075/1. FF is supported by a UKRI Future Leaders Fellowship (grant no. MR/X033740/1).
References
- Athanassoula, E. 1992, MNRAS, 259, 328 [NASA ADS] [CrossRef] [Google Scholar]
- Athanassoula, E. 2013, in Secular Evolution of Galaxies, eds. J. Falcón-Barroso, & J. H. Knapen, 305 [Google Scholar]
- Bureau, M., & Athanassoula, E. 2005, ApJ, 626, 159 [Google Scholar]
- Bureau, M., Aronica, G., Athanassoula, E., et al. 2006, MNRAS, 370, 753 [NASA ADS] [CrossRef] [Google Scholar]
- Chung, A., & Bureau, M. 2004, AJ, 127, 3192 [NASA ADS] [CrossRef] [Google Scholar]
- Corsini, E. M., Morelli, L., Pastorello, N., et al. 2016, MNRAS, 457, 1198 [CrossRef] [Google Scholar]
- de Sá-Freitas, C., Gadotti, D. A., Fragkoudi, F., et al. 2023, A&A, 678, A202 [NASA ADS] [CrossRef] [EDP Sciences] [Google Scholar]
- de Sá-Freitas, C., Gadotti, D. A., Fragkoudi, F., et al. 2025, A&A, 698, A5 [NASA ADS] [CrossRef] [EDP Sciences] [Google Scholar]
- Debattista, V. P., Ness, M., Gonzalez, O. A., et al. 2017, MNRAS, 469, 1587 [Google Scholar]
- Ding, Y., Zhu, L., van de Ven, G., et al. 2023, A&A, 672, A84 [NASA ADS] [CrossRef] [EDP Sciences] [Google Scholar]
- Emsellem, E., Schinnerer, E., Santoro, F., et al. 2022, A&A, 659, A191 [NASA ADS] [CrossRef] [EDP Sciences] [Google Scholar]
- Erwin, P., Saglia, R. P., Fabricius, M., et al. 2015, MNRAS, 446, 4039 [Google Scholar]
- Fragkoudi, F., Di Matteo, P., Haywood, M., et al. 2017, A&A, 607, L4 [NASA ADS] [CrossRef] [EDP Sciences] [Google Scholar]
- Fragkoudi, F., Grand, R. J. J., Pakmor, R., et al. 2020, MNRAS, 494, 5936 [Google Scholar]
- Fraser-McKelvie, A., van de Sande, J., Gadotti, D. A., et al. 2025, A&A, 700, A237 [NASA ADS] [CrossRef] [EDP Sciences] [Google Scholar]
- Gadotti, D. A. 2025, ArXiv e-prints [arXiv:2511.13823] [Google Scholar]
- Gadotti, D. A., Seidel, M. K., Sánchez-Blázquez, P., et al. 2015, A&A, 584, A90 [NASA ADS] [CrossRef] [EDP Sciences] [Google Scholar]
- Gadotti, D. A., Bittner, A., Falcón-Barroso, J., et al. 2020, A&A, 643, A14 [NASA ADS] [CrossRef] [EDP Sciences] [Google Scholar]
- Gonzalez, O. A., Gadotti, D. A., Debattista, V. P., et al. 2016, A&A, 591, A7 [NASA ADS] [CrossRef] [EDP Sciences] [Google Scholar]
- Guérou, A., Emsellem, E., Krajnović, D., et al. 2016, A&A, 591, A143 [NASA ADS] [CrossRef] [EDP Sciences] [Google Scholar]
- Häußler, B., Vika, M., Bamford, S. P., et al. 2022, A&A, 664, A92 [NASA ADS] [CrossRef] [EDP Sciences] [Google Scholar]
- Hawarden, T. G., Mountain, C. M., Leggett, S. K., & Puxley, P. J. 1986, MNRAS, 221, 41P [NASA ADS] [CrossRef] [Google Scholar]
- Johnston, E. J., Häußler, B., Aragón-Salamanca, A., et al. 2017, MNRAS, 465, 2317 [Google Scholar]
- Lange, R., Moffett, A. J., Driver, S. P., et al. 2016, MNRAS, 462, 1470 [NASA ADS] [CrossRef] [Google Scholar]
- Leaman, R., Fragkoudi, F., Querejeta, M., et al. 2019, MNRAS, 488, 3904 [NASA ADS] [CrossRef] [Google Scholar]
- Martig, M., Pinna, F., Falcón-Barroso, J., et al. 2021, MNRAS, 508, 2458 [NASA ADS] [CrossRef] [Google Scholar]
- Martinez-Valpuesta, I., & Gerhard, O. 2013, ApJ, 766, L3 [NASA ADS] [CrossRef] [Google Scholar]
- Oh, S., Colless, M., Barsanti, S., et al. 2020, MNRAS, 495, 4638 [Google Scholar]
- Pak, M., Lee, J. H., Oh, S., et al. 2021, ApJ, 921, 49 [NASA ADS] [CrossRef] [Google Scholar]
- Pinna, F., Falcón-Barroso, J., Martig, M., et al. 2019, A&A, 623, A19 [NASA ADS] [CrossRef] [EDP Sciences] [Google Scholar]
- Poci, A., McDermid, R. M., Lyubenova, M., et al. 2021, A&A, 647, A145 [NASA ADS] [CrossRef] [EDP Sciences] [Google Scholar]
- Querejeta, M., Schinnerer, E., Meidt, S., et al. 2021, A&A, 656, A133 [NASA ADS] [CrossRef] [EDP Sciences] [Google Scholar]
- Sarzi, M., Ledo, H. R., Coccato, L., et al. 2016, MNRAS, 457, 1804 [NASA ADS] [CrossRef] [Google Scholar]
- Schultheis, M., Sormani, M. C., & Gadotti, D. A. 2025, ArXiv e-prints [arXiv:2509.04562] [Google Scholar]
- Seidel, M. K., Falcón-Barroso, J., Martínez-Valpuesta, I., et al. 2015, MNRAS, 451, 936 [NASA ADS] [CrossRef] [Google Scholar]
- Sellwood, J. A. 2014, Rev. Mod. Phys., 86, 1 [Google Scholar]
- Seo, W.-Y., Kim, W.-T., Kwak, S., et al. 2019, ApJ, 872, 5 [NASA ADS] [CrossRef] [Google Scholar]
- Tabor, M., Merrifield, M., Aragón-Salamanca, A., et al. 2019, MNRAS, 485, 1546 [NASA ADS] [CrossRef] [Google Scholar]
- Tully, R. B., Kourkchi, E., Courtois, H. M., et al. 2023, ApJ, 944, 94 [NASA ADS] [CrossRef] [Google Scholar]
- van de Sande, J., Fraser-McKelvie, A., Fisher, D. B., et al. 2024, IAU Symp., 377, 27 [Google Scholar]
- Verwilghen, P., Emsellem, E., Renaud, F., et al. 2024, A&A, 687, A53 [NASA ADS] [CrossRef] [EDP Sciences] [Google Scholar]
All Figures
|
Fig. 1. Components of the image decomposition of PGC 044931. Panel (a): sky-subtracted H-band VIRCAM image (arcsinh scaled). Panel (b): residual map after subtraction of the five components (linear scale). Panels (c) to (g): the five components fit with IMFIT (arcsinh scale, limits altered to show maximum structure). Panel (h): spatial extent of the three dominant components. The extended disc is shown in purple, and the boxy-peanut bulge is in pink. The nuclear disc (yellow) is very small and only dominates near the centre. |
| In the text | |
|
Fig. 2. Masking regions from Fig. 1h overlaid as grey contours on light-weighted stellar kinematic (a) V★, (b) h3, and population (c) age along with (d) metallicity maps of PGC 044931. White regions denote masked regions (e.g. due to foreground stars) or areas in which the spaxels did not reach the minimum continuum S/N threshold of 5. A distinctive metal-rich ‘X’ shape is present in the metallicity map. This feature has been seen in other galaxies (e.g. NGC 4710; Gonzalez et al. 2016) and is in agreement with simulations (e.g. Debattista et al. 2017; Fragkoudi et al. 2020). |
| In the text | |
|
Fig. 3. Separation of the photometric components of PGC 044931 in stellar kinematic and stellar population space. Left: stellar h3 versus V★/σ★, with data points corresponding to Voronoi bins for which the majority of the bin is located in one of the photometric regions. The underlying extended disc, boxy-peanut bulge (bar), and nuclear disc show distinctly different behaviours in this parameter space, allowing us to confidently make inferences about their star formation histories. Right: mean light-weighted stellar metallicity versus stellar age. The nuclear disc is clearly separated from the bar and boxy-peanut bulge, and the boxy-peanut region is on average older and more metal rich than the underlying disc. The colour saturation indicates the fraction of light attributed to the given component in each bin. |
| In the text | |
Current usage metrics show cumulative count of Article Views (full-text article views including HTML views, PDF and ePub downloads, according to the available data) and Abstracts Views on Vision4Press platform.
Data correspond to usage on the plateform after 2015. The current usage metrics is available 48-96 hours after online publication and is updated daily on week days.
Initial download of the metrics may take a while.