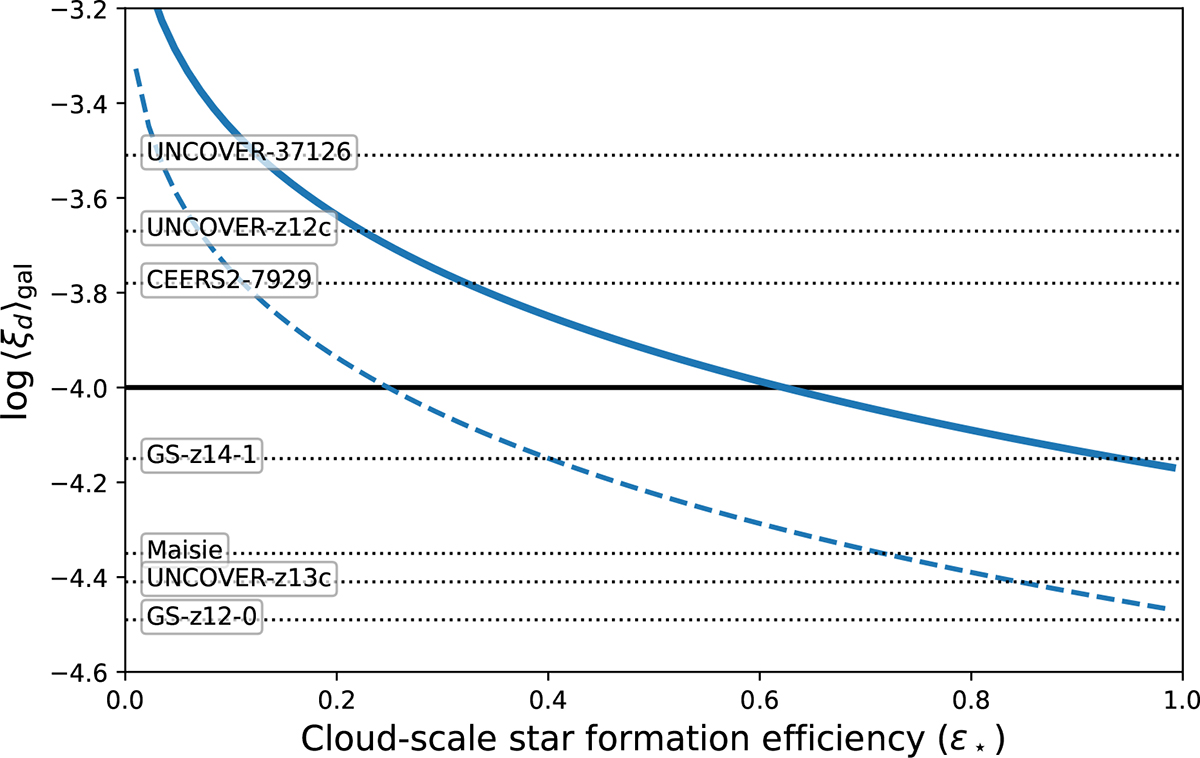
Fig. 2.
Download original image
Galaxy-integrated dust-to-stellar mass ratio vs. the cloud-scale star formation efficiency. The solid blue curve corresponds to log ξd, 0 = −2.669, and the dashed blue curve corresponds to a reduction by a factor of two in ξd, 0, consistent with either reduced supernova dust mass production or reduced dust survival. The horizontal solid line marks log⟨ξd⟩gal = −4. The dotted horizontal lines annotate log⟨ξd⟩gal for a subset of spectroscopically confirmed blue monsters as inferred by Ferrara et al. (2025).
Current usage metrics show cumulative count of Article Views (full-text article views including HTML views, PDF and ePub downloads, according to the available data) and Abstracts Views on Vision4Press platform.
Data correspond to usage on the plateform after 2015. The current usage metrics is available 48-96 hours after online publication and is updated daily on week days.
Initial download of the metrics may take a while.