| Issue |
A&A
Volume 705, January 2026
|
|
|---|---|---|
| Article Number | L10 | |
| Number of page(s) | 4 | |
| Section | Letters to the Editor | |
| DOI | https://doi.org/10.1051/0004-6361/202557333 | |
| Published online | 12 January 2026 | |
Letter to the Editor
Missing dust of super-early galaxies
Supernova blowout and gas–dust venting in blue monsters
1
Instituto Nacional de Astrofísica, Óptica y Electrónica, AP 51 72000 Puebla, Mexico
2
Astronomical Institute of the Czech Academy of Sciences Boční II 1401/1 141 00 Praha 4, Czech Republic
3
Instituto de Astrofísica de Canarias E 38200 La Laguna Tenerife, Spain
4
Departamento de Astrofísica, Universidad de La Laguna E 38205 La Laguna Tenerife, Spain
★ Corresponding author: This email address is being protected from spambots. You need JavaScript enabled to view it.
Received:
20
September
2025
Accepted:
3
December
2025
Abstract
Context. A subset of very young super-early galaxies at z ≳ 10, often called blue monsters, shows extremely blue UV continua and faint far-IR emission. This might imply much less dust than expected from standard enrichment scenarios.
Aims. We wish to understand the reason for the apparent absence of dust in the blue monsters. To do this, we show by combining full 3D hydrodynamical dust-survival yields with 3D thin-shell scalings that clustered supernovae drive a mechanical blowout in stratified self-gravitating clouds, and we predict the retained dust-to-stellar mass ratio at the cluster scale and the corresponding galaxy-integrated value.
Methods. We took the net dust yield per unit stellar mass from existing 3D hydrodynamical studies of young stellar clusters with sequential supernovae, and we set the blowout radius as a function of gas concentration using established 3D thin-shell scalings. For an assumed gas–dust coupling across the blowout boundary, the retained dust-to-stellar ratio accounts for the fraction of supernovae that remain confined versus those that vent mechanically.
Results. For all typical cluster masses, sizes, and cloud-scale star formation efficiencies, mechanical venting removes a large part of gas and dust. The retained dust-to-stellar mass ratio is lowered by about one-half to two orders of magnitude relative to the supernova net dust yield. The outcome mainly depends on the gas concentration and only weakly on metallicity, and it therefore remains effective at low Z. After weighting by a Schechter cluster mass function and a Weibull core–radius distribution, the galaxy-integrated value falls in the same range inferred for spectroscopically confirmed blue monsters.
Conclusions. Mechanical venting at the cluster scale can account for the very low dust fractions inferred for blue monsters without requiring extreme in situ destruction and without fine-tuning.
Key words: dust, extinction / galaxies: evolution / galaxies: high-redshift / galaxies: star clusters: general
© The Authors 2026
 Open Access article, published by EDP Sciences, under the terms of the Creative Commons Attribution License (https://creativecommons.org/licenses/by/4.0), which permits unrestricted use, distribution, and reproduction in any medium, provided the original work is properly cited.
This article is published in open access under the Subscribe to Open model. This email address is being protected from spambots. You need JavaScript enabled to view it. to support open access publication.
1. Introduction
Very young compact super-early galaxies with blue UV slopes and weak far-IR emission require an efficient removal or destruction of freshly condensed dust from star-forming regions or a dust population with an intrinsically low UV opacity (e.g., large supernova-produced grains) that can yield very blue continua (Narayanan et al. 2025). These pathways are relevant for the population often called “blue monsters”, whose extreme UV colors β ≈ −2.5 to −2.6 and very low extinction at z ≳ 10 challenge standard dust- and metal-enrichment scenarios (Arrabal Haro et al. 2023; Ziparo et al. 2023; Yoon et al. 2023; Bakx et al. 2023; Ferrara et al. 2025; Cullen et al. 2024; Zavala et al. 2025). In models without outflows, even allowing wide variations in dust yields and destruction, the predicted dust-to-stellar mass ratio ξd ≡ Md/M* falls around log ξd ≈ −2.2, whereas an interpretation of the current Blue Monster V-band attenuation implies log ξd ≲ −4 (Ferrara et al. 2025). In turn, this mismatch might indicate a dynamical origin of the transparency: Feedback must clear grains faster than the young stellar population builds up, most efficiently along low-resistance paths in a clumpy medium. There, clustered winds and supernovae carve low-density corridors that drive mechanical blowout, venting hot gas and newly formed dust from their birth clouds.
Supernovae typically explode in clustered star-forming complexes embedded in nonuniform media (Parizot et al. 2004), where density asymmetries shape their evolution. Since mechanical blowout is most effective on cluster scales, its strength increases as star formation becomes more clustered at early times, and the resulting venting delays the enrichment in star-forming regions and the chemical evolution of molecular clouds and galaxies (Jiménez et al. 2019, 2021). Empirically, the fraction of stars that form in compact stellar clusters increases with redshift and is consistent with dominance by z ≈ 6 (Vanzella et al. 2019); this is supported by lensed parsec-scale systems at z = 6.143 (Vanzella et al. 2019), zspec = 8.296 (Mowla et al. 2024), z ≈ 10.2 (Adamo et al. 2024), and z = 10.603 (Senchyna et al. 2024), by the increase in cluster-formation efficiency with gas pressure (Kruijssen 2012; Adamo et al. 2015), and by the increasing star formation rate surface density from z ≈ 4 to z ≈ 10 (Calabrò et al. 2024). At the galaxy scale, blue monsters are compact in the rest-UV, with half-light radii of about 0.1 to 1 kpc at 9 ≲ z ≲ 13, as summarized by Somerville et al. (2025), and references therein). This compactness shortens the path to the vertical scale height and allows the low-column channels from parsec-scale blowout to remain open and vent gas and dust from the galaxy (Tenorio-Tagle 1996).
We combine 3D simulations of supernova-driven dust processing in massive clusters with thin-shell blowout scalings to predict blue-monster transparency. The structure of the paper is as follows: Section 2 develops the analytic framework, linking dust injection/survival (Sect. 2.1) to thin-shell blowout and mechanical venting (Sect. 2.2). Section 3 maps parameter space and identifies conditions that yield log⟨ξd⟩gal ≈ −4. Section 4 discusses limitations, and Section 5 summarizes implications for blue monsters.
2. Model
In order to assess the transparency of blue monsters, our model combines 3D hydrodynamical simulations of supernova-driven dust injection and destruction in massive star clusters with thin-shell blowout scalings. This yields the retained dust-to-stellar mass ratio as a function of cluster gas mass and core radius.
2.1. Dust injection and survival
The 3D hydrodynamical simulations of Martínez-González et al. (2022) followed dust injection and survival of 186 pair-instability and 50 core-collapse supernovae in a young massive stellar cluster within a low-metallicity clumpy molecular cloud. In addition to the stellar and gaseous gravitational pull, the simulations include turbulent motions and radiative cooling, and an explicit treatment of multiple dust-processing channels: the passage of the supernova reverse shock through the ejecta, the injection of shocked stellar winds, and secondary forward shocks produced in sequential supernova explosions via thermal sputtering. The evolution is intrinsically nonspherical: Off-center supernovae expand down local density gradients and into a wind-blown corrugated shell, which accelerates Rayleigh–Taylor growth, fragments the swept-up wall, and punches low-column density chimneys. The resulting shell is porous and highly anisotropic, which provides preferential escape routes for gas and dust (for other processes see Martínez-González 2025a,b). These simulations adopted a Kroupa initial mass function (IMF, Kroupa 2001) over [0.01, 120]M⊙, aa metallicity Z = 2 × 10⁻² Z⊙, a star cluster mass of 5.6 × 10⁵ M⊙, and the Bonn optimized stellar tracks (BoOST Szécsi et al. 2022). For pair-instability supernovae, a dust condensation efficiency of 3.2% of the progenitor final mass was adopted (Cherchneff 2010); for core-collapse supernovae, the injected dust mass was drawn from a normal distribution with a mean of 0.6 M⊙ and standard deviation of 0.1 M⊙1. The fraction of the dust budget that survives the sequence of supernova explosions was sustained at about 15–20%, consistent with Martínez-González et al. (2018) for type IIb and II P supernovae from progenitors formed at solar metallicity in a young stellar cluster with mass 106 M⊙. We therefore adopted the scaling of Martínez-González et al. (2022),
 (1)
(1)
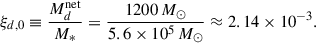
Here, Mdnet denotes the dust mass that remains after shock processing, that is, ξd, 0 is the net supernova dust yield per unit stellar–cluster mass, corresponding to log ξd, 0 ≈ −2.669.
2.2. Mechanical venting
The venting of gas was taken into account following the thin-shell relations derived by Jiménez et al. (2019, 2021), which also include the gravitational pull of the gas and star, turbulent pressure, and radiative cooling. The authors assumed that gas and massive stars within individual stellar clusters followed Gaussian profiles of the core radius Rc. The decisive variable is the concentration:
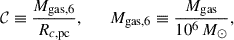 (2)
(2)
with Rc, pc in parsecs. The relations identify Rblow, the radius at which the shell ceases to be pressure confined, as
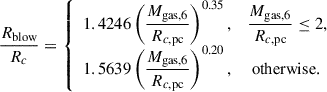 (3)
(3)
Rblow depends on Mgas and Rc, not on the metallicity Z, because early supernova remnant evolution is dominated by free–free cooling in dense gas (see Fig. 7 in Jiménez et al. 2021). The supernovae were distributed as a 3D Gaussian with a core radius Rc. The enclosed supernova mass fraction is
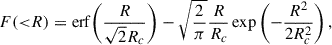 (4)
(4)
which we use to define the mechanical venting fraction:
 (5)
(5)
When we assume gas–dust coupling, the retained dust-to-stellar mass ratio follows
![Mathematical equation: $$ \begin{aligned} \xi _{d}(M_{\rm {gas}},R_{c}) = \xi _{d,0}\,\bigl [1-f_{\rm {mech}}(M_{\rm {gas}},R_{c})\bigr ]. \end{aligned} $$](/articles/aa/full_html/2026/01/aa57333-25/aa57333-25-eq6.gif) (6)
(6)
To map the gas and stellar masses, we used the scaling M* = ε★Mgas, where ε★ is the cloud-scale star formation efficiency. We obtained the galaxy-integrated dust-to-stellar mass ratio, ⟨ξd⟩gal, by averaging over the distributions of the star cluster radii and masses. We used a Weibull distribution function for the star cluster radii, mapping to the 3D–Gaussian core via  . The radius distribution function, normalized to unity on Rc ∈ [0.5, 20] pc, was pR(Rc) = (k/λc) tk − 1e−tk/𝒩R, where t = (Rc − R0, c)/λc,
  ,
,  , and
, and  with tmin = (0.5 − R0, c)/λc and tmax = (20 − R0, c)/λc; we used k = 2.22, λ = 3.64 pc, and R0 = 0.185 pc (Brown & Gnedin 2021). We adopted a Schechter cluster mass function (CMF) with ϕ(M★) = A M★−2e−M★/Mc on M★ ∈ [103, 107] M⊙ and Mc = 106 M⊙ (e.g. Larsen 2009). The CMF weight was WM(M★) = e−M★/Mc dlnM★/𝒩M, where 𝒩M = ∫103107e−M/Mc dlnM. Because WM and pR are normalized as defined above, 𝒩M, 𝒩R, and the CMF amplitude A cancel each other out. The galaxy–integrated ratio is thus
 (7)
(7)
3. Results
Figure 1 maps the retained dust-to-stellar mass ratio log ξd for two cases of the cloud-scale star formation efficiency (ε★ = 0.10, 0.50 Grudić et al. 2018). The pattern follows the gas concentration 𝒞 = Mgas, 6/Rc, pc: At lower 𝒞, the blowout radius grows relative to Rc, more supernovae explode beyond Rblow, and ξd decreases. The dashed curves show fmech = 0.5 and the solid contours mark log ξd = −4. Very massive and extremely compact star clusters with deep gravitational potentials maintain high 𝒞 and suppress blowout, retaining more dust (see Rodighiero et al. 2023).
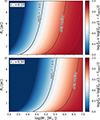 |
Fig. 1. Predicted retained dust-to-stellar mass ratio for star clusters as a function of stellar mass and star cluster core radius, shown for cloud-scale star formation efficiencies ε★ = 0.10 (upper panel) and 0.50 (lower panel). The colors encode log ξd = log[ξd, 0 (1 − fmech)] with ξd, 0 = 2.14 × 10⁻³. The dashed black curves mark fmech = 0.5, and the solid black contours display log ξd = −4, the characteristic level inferred for blue monsters. |
Since ξd = ξd, 0(1 − fmech) with log ξd, 0 ≈ −2.669, reaching log ξd = −4 needs fmech ≳ 0.95. The maps show that this level is reached in a broad domain of (M*, Rc, ε★). As an example, for Rc ≈ 5 pc and ε★ = 0.50, the log ξd = −4 contour appears near M* ≈ 105 M⊙. Extended clusters reach low ξd at higher M* than compact clusters because 𝒞 is smaller.
Figure 2 shows that for ε★ = (0 − 1), the weighted log⟨ξd⟩gal lies around −4 without fine tuning, and it decreases monotonically with ε★. The dotted horizontal lines indicate the inferred model-dependent log⟨ξd⟩gal for selected blue monsters, and they fall in the same range as inferred from V-band attenuation by Ferrara et al. (2025). We note that the inferred log⟨ξd⟩gal ≈ −4 values depend on the assumed galaxy geometry and size and on the dust model, and that line-of-sight extinction is sensitive to inclination and to the relative distribution of dust and stars. A low extinction by itself therefore does not imply a low total dust mass (see Chevallard et al. 2013; Sommovigo et al. 2025).
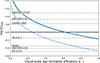 |
Fig. 2. Galaxy-integrated dust-to-stellar mass ratio vs. the cloud-scale star formation efficiency. The solid blue curve corresponds to log ξd, 0 = −2.669, and the dashed blue curve corresponds to a reduction by a factor of two in ξd, 0, consistent with either reduced supernova dust mass production or reduced dust survival. The horizontal solid line marks log⟨ξd⟩gal = −4. The dotted horizontal lines annotate log⟨ξd⟩gal for a subset of spectroscopically confirmed blue monsters as inferred by Ferrara et al. (2025). |
4. Model limitations
The thin-shell scalings span a wider parameter space in gas concentration 𝒞 = Mgas, 6/Rc, pc and in the core radius Rc (the same Rc was adopted for the stellar and gaseous components, both taken as Gaussian density profiles), while the 3D hydrodynamical runs, although they follow edhundreds of sequential supernovae with resolved shocked stellar winds and forward and reverse shocks, cover a narrower range of stellar cluster masses and Rc. It is therefore an extrapolation to use ξd, 0 outside this mass range.
Our current model omits radiation pressure and radiative transfer. Radiation-pressure forces can decouple dust and gas and break the link between line-of-sight extinction and total dust mass (Ziparo et al. 2023; Sommovigo et al. 2020; Menon et al. 2025), while dust–star geometry and radiative transfer further modify the attenuation (Salim & Narayanan 2020; Narayanan et al. 2018; Sommovigo et al. 2025; Di Mascia et al. 2025; Matsumoto et al. 2025; Dubois et al. 2024; Draine 2011). In young star clusters, radiative and mechanical feedback act on comparable early timescales (Rahner et al. 2017). Radiation pressure can preclear low-column channels and accelerate early shell growth, which would increase the mechanical venting fraction fmech at fixed (Mgas, Rc). Time-dependent models indicate that its dynamical dominance is brief and mainly precedes the supernova phase, after which winds and supernovae set the shell evolution (Silich & Tenorio-Tagle 2013; Martínez-González et al. 2014). Because the supernova-condensed grains we tracked are produced after this phase, it would likely strengthen the trend toward low ⟨ξd⟩gal if we added radiation pressure. Our mechanical-only ξd should therefore be regarded as conservative upper limits.
We did not model IMF variations. A top-heavy IMF increases the specific supernova rate and UV momentum per unit stellar mass, which boosts supernova dust production and early radiative and wind driving; this opens and sustains low-column channels, increases the mechanical venting fraction fmech at fixed (Mgas, Rc), and tends to lower the cloud-scale star-formation efficiency ε★ (Menon et al. 2024).
Supernova–condensed dust yields, particularly at high redshift, remain highly uncertain; the adopted ξd, 0 should be taken as an indicative normalization. On the positive side, the 15–20% survival fractions used here come from on-the-fly grain processing within high-resolution 3D hydrodynamical simulations of sequential supernovae, and they are therefore comparatively robust (Martínez-González et al. 2018, 2022). The surviving dust is produced predominantly by off-centered supernovae (Martínez-González et al. 2018). It follows that the fraction of surviving dust formed at r > Rblow is expected to be at least as large as the geometric fraction of supernovae exploding beyond Rblow. Using ξd = ξd, 0 [1 − fmech] therefore yields an upper bound on the retained dust. We note that most studies of reverse-shock-driven dust destruction, as reviewed by Schneider & Maiolino (2024), assumed uniform or phase-averaged media and derived efficiencies from Sedov-Taylor similarity solutions. In clustered supernovae, shocks transmitted into the wind-blown shell are strongly radiative, the shell is not overrun, and no Sedov-Taylor phase ever develops. Consequently, phase-averaged models are not directly applicable to our case (Martínez-González et al. 2018, 2019, 2022, see also Serrano-Hernández et al. 2025. Martínez-González (2025a,b), Kirchschlager et al. (2024)).
In contrast to the 3D thin-shell simulations, the full 3D hydrodynamical simulations place a Schuster stellar density distribution within a clumpy molecular cloud, so that porosity and inhomogeneities are resolved. Currently, there are no available statistics on blue monsters or on the potential dependence of their properties on redshift. In our framework, the key parameters are the concentration and mass of the clusters. As more data become available, it will be possible to determine the conditions that lead to dust expulsion, and conversely, the conditions under which a substantial fraction of supernova-produced dust and gas are retained.
5. Conclusions
We combined net supernova dust yields from full 3D hydrodynamical stellar cluster simulations with 3D thin-shell blowout scalings to predict the dust-to-stellar mass ratio in young stellar clusters within super-early galaxies at z ≳ 10. Mechanical blowout alone reduces ξd by one to two orders of magnitude and reaches log ξd ≈ −4 over a wide range of radii, cloud-scale star formation efficiencies, and stellar cluster masses. The transition to very low ξd follows the gas concentration and not the metallicity, and it remains effective at low Z. After weighting by the cluster mass function and a core-radius distribution and without fine-tuning, the galaxy-integrated value log⟨ξd⟩gal lies in the same range as inferred values for spectroscopically confirmed super-early galaxies that are commonly called blue monsters. The most numerous clusters are also most prone to blowout, and their transparency is therefore expected. A minority cluster population at the opposite extreme, consisting of very massive and extremely compact clusters with deep gravitational potentials, can suppress blowout, retain more dust, and lead to a positive feedback scenario (Tenorio-Tagle et al. 2006, 2013; Silich et al. 2010; Amorín et al. 2009). Since feedback in the form of radiation pressure only dominates before the onset of supernovae (Tenorio-Tagle et al. 2006; Grudić et al. 2018), it cannot expel the bulk of the dust that is newly condensed in supernova ejecta. Supernova blowout therefore provides a natural channel for removing this dust into galactic halos.
Acknowledgments
The authors thank the anonymous referee for their helpful comments and suggestions that improved the quality of the paper. SJ acknowledges support by the Czech Ministry of Education, Youth and Sports, through the INTER-EXCELLENCE II program, project LUC24023, and by the institutional project RVO:67985815. This work is part of the collaboration ESTALLIDOS, supported by the Spanish research grants, PID2019-107408GB-C43 and PID2022-136598NB-C31 (ESTALLIDOS 8) from the Spanish Ministry of Science and Innovation. The authors thankfully acknowledge the computer resources, technical expertise and support provided by the Laboratorio Nacional de Supercómputo del Sureste de México, SECIHTI member of the network of national laboratories.
References
- Adamo, A., Kruijssen, J. M. D., Bastian, N., Silva-Villa, E., & Ryon, J. 2015, MNRAS, 452, 246 [NASA ADS] [CrossRef] [Google Scholar]
- Adamo, A., Bradley, L. D., Vanzella, E., et al. 2024, Nature, 632, 513 [NASA ADS] [CrossRef] [Google Scholar]
- Amorín, R., Aguerri, J. A. L., Muñoz-Tuñón, C., & Cairós, L. M. 2009, A&A, 501, 75 [NASA ADS] [CrossRef] [EDP Sciences] [Google Scholar]
- Arrabal Haro, P., Dickinson, M., Finkelstein, S. L., et al. 2023, ApJ, 951, L22 [NASA ADS] [CrossRef] [Google Scholar]
- Bakx, T. J. L. C., Zavala, J. A., Mitsuhashi, I., et al. 2023, MNRAS, 519, 5076 [NASA ADS] [CrossRef] [Google Scholar]
- Bevan, A., Barlow, M. J., & Milisavljevic, D. 2017, MNRAS, 465, 4044 [NASA ADS] [CrossRef] [Google Scholar]
- Brown, G., & Gnedin, O. Y. 2021, MNRAS, 508, 5935 [NASA ADS] [CrossRef] [Google Scholar]
- Calabrò, A., Pentericci, L., Santini, P., et al. 2024, A&A, 690, A290 [NASA ADS] [CrossRef] [EDP Sciences] [Google Scholar]
- Cherchneff, I. 2010, in Hot and Cool: Bridging Gaps in Massive Star Evolution, eds. C. Leitherer, P. D. Bennett, P. W. Morris, & J. T. Van Loon, ASP Conf. Ser., 425, 237 [Google Scholar]
- Chevallard, J., Charlot, S., Wandelt, B., & Wild, V. 2013, MNRAS, 432, 2061 [CrossRef] [Google Scholar]
- Cullen, F., McLeod, D. J., McLure, R. J., et al. 2024, MNRAS, 531, 997 [NASA ADS] [CrossRef] [Google Scholar]
- De Looze, I., Barlow, M. J., Swinyard, B. M., et al. 2017, MNRAS, 465, 3309 [NASA ADS] [CrossRef] [Google Scholar]
- Di Mascia, F., Pallottini, A., Sommovigo, L., & Decataldo, D. 2025, A&A, 695, A77 [NASA ADS] [CrossRef] [EDP Sciences] [Google Scholar]
- Draine, B. T. 2011, ApJ, 732, 100 [NASA ADS] [CrossRef] [Google Scholar]
- Dubois, Y., Rodríguez Montero, F., Guerra, C., et al. 2024, A&A, 687, A240 [NASA ADS] [CrossRef] [EDP Sciences] [Google Scholar]
- Ferrara, A., Pallottini, A., & Sommovigo, L. 2025, A&A, 694, A286 [NASA ADS] [CrossRef] [EDP Sciences] [Google Scholar]
- Grudić, M. Y., Hopkins, P. F., Faucher-Giguère, C.-A., et al. 2018, MNRAS, 475, 3511 [CrossRef] [Google Scholar]
- Jiménez, S., Tenorio-Tagle, G., & Silich, S. 2019, MNRAS, 488, 978 [Google Scholar]
- Jiménez, S., Tenorio-Tagle, G., & Silich, S. 2021, MNRAS, 505, 4669 [Google Scholar]
- Kirchschlager, F., Mattsson, L., & Gent, F. A. 2024, Nat. Commun., 15, 1841 [NASA ADS] [CrossRef] [Google Scholar]
- Kroupa, P. 2001, MNRAS, 322, 231 [NASA ADS] [CrossRef] [Google Scholar]
- Kruijssen, J. M. D. 2012, MNRAS, 426, 3008 [Google Scholar]
- Larsen, S. S. 2009, A&A, 494, 539 [NASA ADS] [CrossRef] [EDP Sciences] [Google Scholar]
- Martínez-González, S. 2025a, A&A, 702, L6 [NASA ADS] [CrossRef] [EDP Sciences] [Google Scholar]
- Martínez-González, S. 2025b, ApJ, 983, 172 [Google Scholar]
- Martínez-González, S., Silich, S., & Tenorio-Tagle, G. 2014, ApJ, 785, 164 [Google Scholar]
- Martínez-González, S., Wünsch, R., Palouš, J., et al. 2018, ApJ, 866, 40 [Google Scholar]
- Martínez-González, S., Wünsch, R., Silich, S., et al. 2019, ApJ, 887, 198 [CrossRef] [Google Scholar]
- Martínez-González, S., Wünsch, R., Tenorio-Tagle, G., et al. 2022, ApJ, 934, 51 [Google Scholar]
- Matsumoto, K., Sommovigo, L., Gebek, A., et al. 2025, arXiv e-prints [arXiv:2508.21157] [Google Scholar]
- Matsuura, M., Dwek, E., Barlow, M. J., et al. 2015, ApJ, 800, 50 [NASA ADS] [CrossRef] [Google Scholar]
- Menon, S. H., Lancaster, L., Burkhart, B., et al. 2024, ApJ, 967, L28 [NASA ADS] [CrossRef] [Google Scholar]
- Menon, S. H., Burkhart, B., Somerville, R. S., Thompson, T. A., & Sternberg, A. 2025, ApJ, 987, 12 [Google Scholar]
- Mowla, L., Iyer, K., Asada, Y., et al. 2024, Nature, 636, 332 [Google Scholar]
- Narayanan, D., Conroy, C., Davé, R., Johnson, B. D., & Popping, G. 2018, ApJ, 869, 70 [Google Scholar]
- Narayanan, D., Torrey, P., Stark, D., et al. 2025, arXiv e-prints [arXiv:2509.18266] [Google Scholar]
- Parizot, E., Marcowith, A., van der Swaluw, E., Bykov, A. M., & Tatischeff, V. 2004, A&A, 424, 747 [NASA ADS] [CrossRef] [EDP Sciences] [Google Scholar]
- Rahner, D., Pellegrini, E. W., Glover, S. C. O., & Klessen, R. S. 2017, MNRAS, 470, 4453 [NASA ADS] [CrossRef] [Google Scholar]
- Rho, J., Gomez, H. L., Boogert, A., et al. 2018, MNRAS, 479, 5101 [NASA ADS] [CrossRef] [Google Scholar]
- Rodighiero, G., Bisigello, L., Iani, E., et al. 2023, MNRAS, 518, L19 [Google Scholar]
- Salim, S., & Narayanan, D. 2020, ARA&A, 58, 529 [NASA ADS] [CrossRef] [Google Scholar]
- Schneider, R., & Maiolino, R. 2024, A&A Rev., 32, 2 [Google Scholar]
- Senchyna, P., Plat, A., Stark, D. P., et al. 2024, ApJ, 966, 92 [NASA ADS] [CrossRef] [Google Scholar]
- Serrano-Hernández, D. B., Martínez-González, S., Jiménez, S., Silich, S., & Wünsch, R. 2025, A&A, 695, A271 [NASA ADS] [CrossRef] [EDP Sciences] [Google Scholar]
- Silich, S., & Tenorio-Tagle, G. 2013, ApJ, 765, 43 [NASA ADS] [CrossRef] [Google Scholar]
- Silich, S., Tenorio-Tagle, G., Muñoz-Tuñón, C., et al. 2010, ApJ, 711, 25 [Google Scholar]
- Somerville, R. S., Yung, L. Y. A., Lancaster, L., et al. 2025, MNRAS, 544, 3774 [Google Scholar]
- Sommovigo, L., Ferrara, A., Pallottini, A., et al. 2020, MNRAS, 497, 956 [NASA ADS] [CrossRef] [Google Scholar]
- Sommovigo, L., Cochrane, R. K., Somerville, R. S., et al. 2025, ApJ, 990, 114 [Google Scholar]
- Szécsi, D., Agrawal, P., Wünsch, R., & Langer, N. 2022, A&A, 658, A125 [NASA ADS] [CrossRef] [EDP Sciences] [Google Scholar]
- Temim, T., Dwek, E., Arendt, R. G., et al. 2017, ApJ, 836, 129 [NASA ADS] [CrossRef] [Google Scholar]
- Tenorio-Tagle, G. 1996, AJ, 111, 1641 [CrossRef] [Google Scholar]
- Tenorio-Tagle, G., Muñoz-Tuñón, C., Pérez, E., Silich, S., & Telles, E. 2006, ApJ, 643, 186 [Google Scholar]
- Tenorio-Tagle, G., Silich, S., Martínez-González, S., et al. 2013, ApJ, 778, 159 [Google Scholar]
- Vanzella, E., Calura, F., Meneghetti, M., et al. 2019, MNRAS, 483, 3618 [Google Scholar]
- Yoon, I., Carilli, C. L., Fujimoto, S., et al. 2023, ApJ, 950, 61 [NASA ADS] [CrossRef] [Google Scholar]
- Zavala, J. A., Castellano, M., Akins, H. B., et al. 2025, Nat. Astron., 9, 155 [Google Scholar]
- Ziparo, F., Ferrara, A., Sommovigo, L., & Kohandel, M. 2023, MNRAS, 520, 2445 [NASA ADS] [CrossRef] [Google Scholar]
In Martínez-González et al. (2022), the choice of 0.6 ± 0.1, M⊙ was guided by observed ejecta dust masses: SN 1987A (≈0.8, M⊙; Matsuura et al. 2015), Cas A (≈0.4–0.6, M⊙; De Looze et al. 2017; up to ≈1.1, M⊙; Bevan et al. 2017), and G54.1+0.3 (up to ≈0.9, M⊙; Rho et al. 2018; 1.1 ± 0.8, M⊙; Temim et al. 2017).
All Figures
|
Fig. 1. Predicted retained dust-to-stellar mass ratio for star clusters as a function of stellar mass and star cluster core radius, shown for cloud-scale star formation efficiencies ε★ = 0.10 (upper panel) and 0.50 (lower panel). The colors encode log ξd = log[ξd, 0 (1 − fmech)] with ξd, 0 = 2.14 × 10⁻³. The dashed black curves mark fmech = 0.5, and the solid black contours display log ξd = −4, the characteristic level inferred for blue monsters. |
| In the text | |
|
Fig. 2. Galaxy-integrated dust-to-stellar mass ratio vs. the cloud-scale star formation efficiency. The solid blue curve corresponds to log ξd, 0 = −2.669, and the dashed blue curve corresponds to a reduction by a factor of two in ξd, 0, consistent with either reduced supernova dust mass production or reduced dust survival. The horizontal solid line marks log⟨ξd⟩gal = −4. The dotted horizontal lines annotate log⟨ξd⟩gal for a subset of spectroscopically confirmed blue monsters as inferred by Ferrara et al. (2025). |
| In the text | |
Current usage metrics show cumulative count of Article Views (full-text article views including HTML views, PDF and ePub downloads, according to the available data) and Abstracts Views on Vision4Press platform.
Data correspond to usage on the plateform after 2015. The current usage metrics is available 48-96 hours after online publication and is updated daily on week days.
Initial download of the metrics may take a while.