Fig. 4.
Download original image
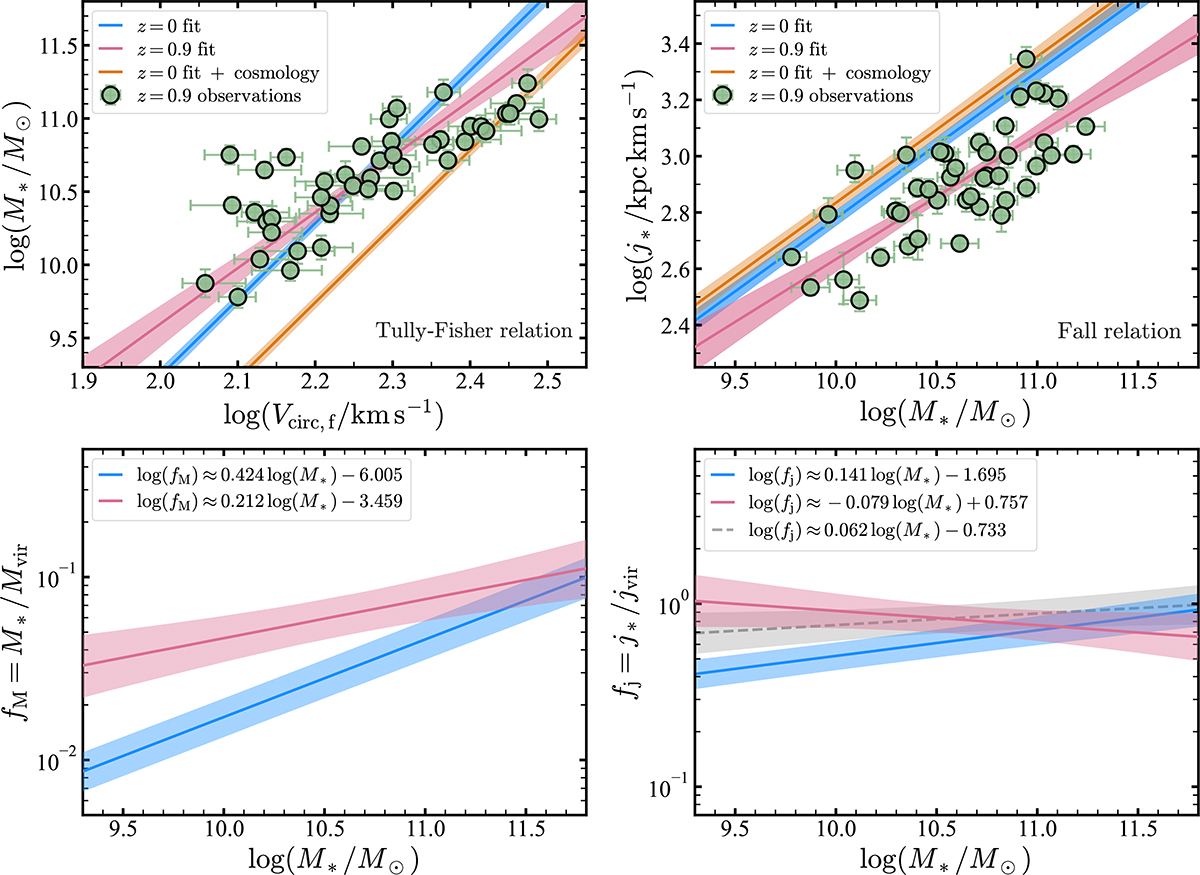
Drivers of the evolution in our scaling relations. The top panels compare how the local TFR and FR (blue curves) would evolve (orange curves) if the only changes are the z evolution of the Hubble parameter and the density contrast, against our high-z data (green markers) and best fits (pink curves). The results imply an evolution of ![]() and
and ![]() . The bottom panels show fM and fj at z = 0 (blue) and z = 0.9 (pink) as a function of M*, as implied by our best-fitting relations after assuming fV = 1.3 ± 0.1. The dashed grey line and bands in the bottom right panel show fj at z = 0.9 under the assumption that fM does not evolve with redshift. In all the panels, bands correspond to 1 σ confidence bands around the mean relations. Note that the vertical axis span in the bottom panels is the same, highlighting the stronger mass dependency of fM over fj.
. The bottom panels show fM and fj at z = 0 (blue) and z = 0.9 (pink) as a function of M*, as implied by our best-fitting relations after assuming fV = 1.3 ± 0.1. The dashed grey line and bands in the bottom right panel show fj at z = 0.9 under the assumption that fM does not evolve with redshift. In all the panels, bands correspond to 1 σ confidence bands around the mean relations. Note that the vertical axis span in the bottom panels is the same, highlighting the stronger mass dependency of fM over fj.
Current usage metrics show cumulative count of Article Views (full-text article views including HTML views, PDF and ePub downloads, according to the available data) and Abstracts Views on Vision4Press platform.
Data correspond to usage on the plateform after 2015. The current usage metrics is available 48-96 hours after online publication and is updated daily on week days.
Initial download of the metrics may take a while.