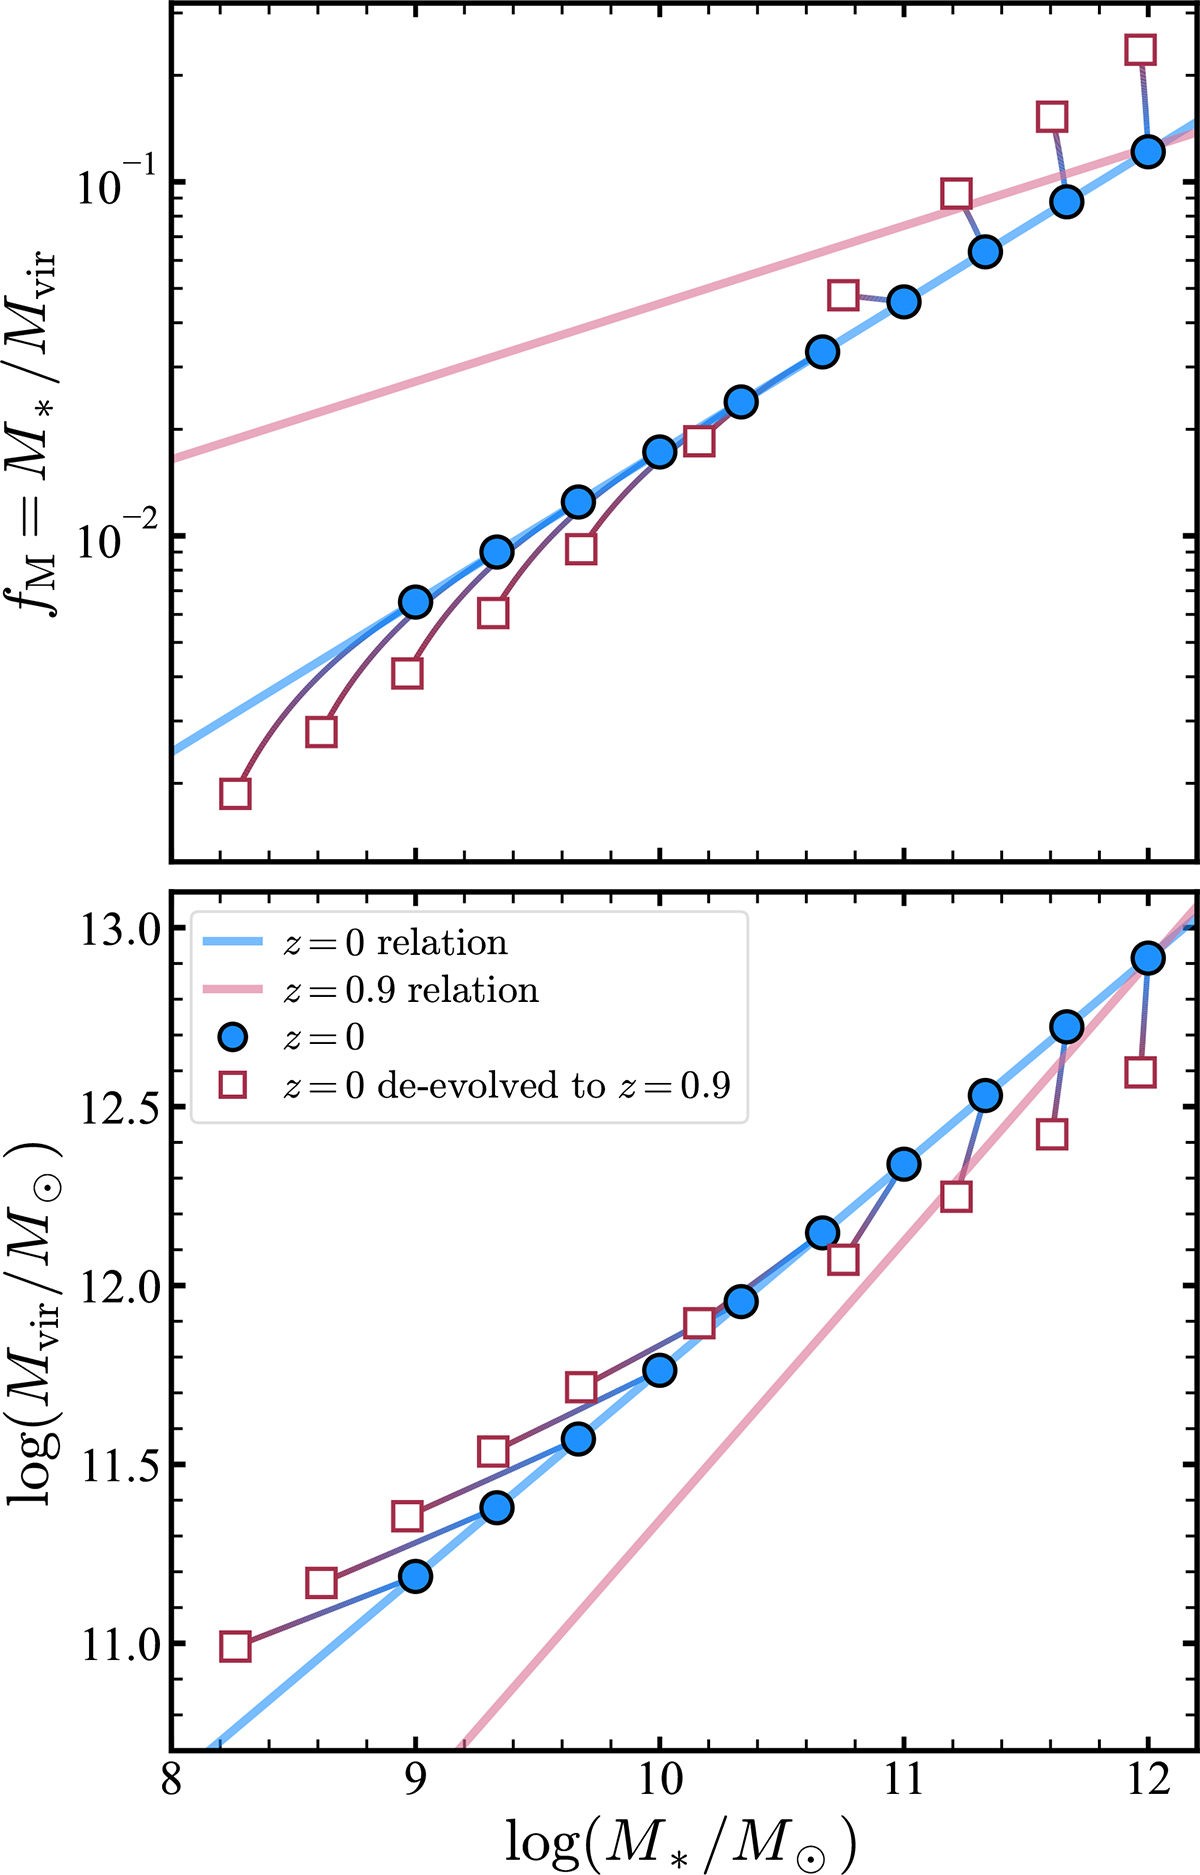
Fig. 5.
Download original image
Comparison between our inferred fM − M* (top) and Mvir − M* (bottom) relations and an idealised toy model of mass assembly. The model considers a population of galaxies (blue circles) lying in the z = 0 relations (blue curves), which are then traced back to z = 0.9 (squares), assuming theoretical stellar and halo mass growths. Galaxy downsizing and halo growth histories yield z = 0.9 relations (squares) with slopes different from those observed at z = 0 (solid pink curves). The only way to reconcile the stellar mass growth of galaxies with our inferred relations at z = 0.9 is if low-mass haloes grew more than high-mass haloes since z = 0.9, contrary to CDM expectations. This suggests that the galaxies populating our z = 0.9 relations do not follow this toy model and are unlikely to be the progenitors of the z = 0 population.
Current usage metrics show cumulative count of Article Views (full-text article views including HTML views, PDF and ePub downloads, according to the available data) and Abstracts Views on Vision4Press platform.
Data correspond to usage on the plateform after 2015. The current usage metrics is available 48-96 hours after online publication and is updated daily on week days.
Initial download of the metrics may take a while.