Fig. A.1.
Download original image
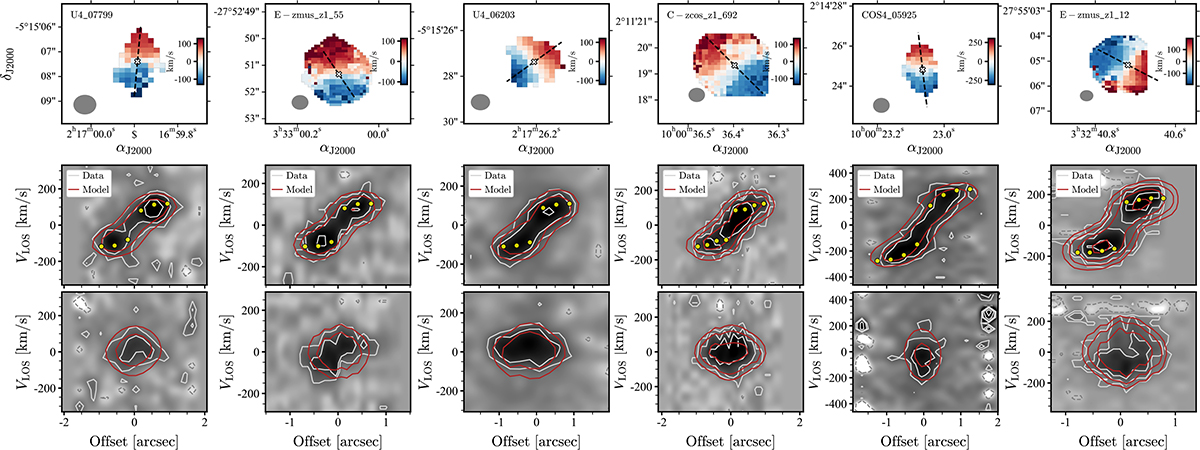
Examples of the kinematic data and models for our sample across our M* range. We show their velocity field (top), major-axis PV (middle), and minor-axis PV (bottom). The top panels also show the centre (white cross), kinematic major axis (dashed black line), and PSF (grey ellipse). In the PV plots, data are shown in a grey background and black contours (grey for negative values), and the best-fitting 3DBarolo model is in red. Line-of-sight velocities are shown in yellow. Contours are at −2, 2, 2nσr.m.s..
Current usage metrics show cumulative count of Article Views (full-text article views including HTML views, PDF and ePub downloads, according to the available data) and Abstracts Views on Vision4Press platform.
Data correspond to usage on the plateform after 2015. The current usage metrics is available 48-96 hours after online publication and is updated daily on week days.
Initial download of the metrics may take a while.