| Issue |
A&A
Volume 705, January 2026
|
|
|---|---|---|
| Article Number | A206 | |
| Number of page(s) | 14 | |
| Section | Interstellar and circumstellar matter | |
| DOI | https://doi.org/10.1051/0004-6361/202557355 | |
| Published online | 23 January 2026 | |
Discovery of linear propadienone
Study of the chemistry of linear and cyclic H2C3O and H2C3S in TMC-1
1
Observatorio Astronómico Nacional (OAN),
Alfonso XII, 3,
28014
Madrid,
Spain
2
Institut des Sciences Moléculaires ISM, CNRS UMR 5255, Univ. Bordeaux,
351 Cours de la Libération,
33400
Talence,
France
3
Instituto de Física Fundamental, CSIC,
Calle Serrano 123,
28006
Madrid,
Spain
4
Observatorio de Yebes, IGN,
Cerro de la Palera s/n,
19141
Yebes,
Guadalajara,
Spain
★ Corresponding authors: This email address is being protected from spambots. You need JavaScript enabled to view it.
; This email address is being protected from spambots. You need JavaScript enabled to view it.
Received:
22
September
2025
Accepted:
17
November
2025
Abstract
We report the first detection in space of propadienone, the linear isomer (l-H2C3O) of cyclopropenone (c-H2C3O). We also report the first detection of the isotopologues c-H213 CCCO and c-HDCCCO of c-H2C3O. The astronomical observations are part of QUIJOTE, a line survey of TMC-1 in the frequency range 31.0–50.3 GHz, complemented with data between 71.6–116.0 GHz, and carried out with Yebes-40 m and IRAM-30 m telescopes, respectively. We obtain a total column density of 3.7 × 1010 cm−2 for l-H2C3O at an excitation temperature of 4.8 K. We find that the isomer is about eight times less abundant than the cyclic one. We also report a detailed line-byline study of cyclopropenethione (c-H2C3S) to compare the abundance of the O and S isomers. We find that cyclic O-isomers are more abundant than cyclic S-isomers; however, the opposite trend is found for the most stable linear isomers, with l-H2C3S being more than one order of magnitude more abundant than l-H2C3O. A comprehensive theoretical chemical analysis shows that the abundances of the H2C3O and H2C3S isomers are controlled by different formation pathways. In particular, while l-H2C3O is potentially produced by dissociative electron recombination reactions, ion-neutral chemistry is more effective at producing l-H2C3S and c-H2C3S.
Key words: ISM: abundances / ISM: clouds / ISM: molecules
© The Authors 2026
 Open Access article, published by EDP Sciences, under the terms of the Creative Commons Attribution License (https://creativecommons.org/licenses/by/4.0), which permits unrestricted use, distribution, and reproduction in any medium, provided the original work is properly cited.
This article is published in open access under the Subscribe to Open model. This email address is being protected from spambots. You need JavaScript enabled to view it. to support open access publication.
1 Introduction
Observations of chemical species allow us to constrain the physical conditions of the interstellar medium (ISM), which exhibits a wide range of temperatures from ∼10–104 K, densities from ∼10–108 cm−3, and the presence of energetic radiation around newly formed stars, as well as galactic UV radiation at the external layers of the clouds. Among the different molecular species, isomers of a given molecule are particularly important since they have the same constituent atoms and therefore a similar level of chemical complexity. This makes them a powerful tool for probing hypotheses about chemical reaction mechanisms in the ISM as their formation and destruction paths directly affect their abundance ratios (Loomis et al. 2015). Many isomers have been detected in the ISM, including some metastable isomers that can be even more abundant than the stable ones (e.g. Halfen et al. 2009; Adande et al. 2010; Marcelino et al. 2010; Cernicharo et al. 2022, Cernicharo et al. 2024a; Esplugues et al. 2024). This highlights the presence of non-equilibrium chemistry in the ISM.
Likewise useful are comparisons between chemically analogous isomers, since they might yield important information about their formation pathways. This could be particularly interesting for sulphur (S) as our present understanding of the chemistry of S-bearing species is highly limited by the molecules detected so far and the chemical network used for these species (e.g. Vidal et al. 2017; Cernicharo et al. 2021c,d,e, 2024a,b; Esplugues et al. 2022, 2023, 2025; Cabezas et al. 2025; Agúndez et al. 2025; Fuente et al. 2025). New detected molecules with sulphur could certainly provide new insights, as could comparisons between sulphur-bearing molecules and their oxygen counterparts, since both elements share the same electron configurations (Remijan et al. 2025; Cabezas et al. 2025; Agúndez et al. 2025).
To this end, we analyse and compare the emission of H2C3O and H2C3S in TMC-1. In particular, propadienthione (l-H2C3S) and cyclopropenethione (c-H2C3S) have recently been detected in TMC-1 by Cernicharo et al. (2021c) and Remijan et al. (2025), respectively. Cyclopropenone (c-H2C3O) was first observed in Sgr B2 by Hollis et al. (2006), and its isomer propynal (HCCCHO) was first detected in TMC-1 by Irvine et al. (1988). However, l-H2C3O remained undetected in spite of being the most thermodynamically stable of the three isomers (Komornicki et al. 1981; Loomis et al. 2015; Shingledecker et al. 2019).
In this paper, we provide the first detection of propadienone (l-H2C3O) in the ISM, as well as the deuterated (c-HDC3O) and 13C substitutions of cyclopropenone. Observations are described in Sect. 2. We also present and discuss our results in Sects. 3 and 4, respectively, including results from a chemical model that allow us to better compare the chemical reactions forming and destroying these S- and O-isomers. We finally summarise our conclusions in Sect. 5.
2 Observations
The observations presented in this work are derived from the ongoing QUIJOTE line survey (31.0–50.3 GHz) carried out with the Yebes 40 m telescope, complemented with data (71.6–116.0 GHz) observed with the IRAM 30 m telescope. A detailed description of the QUIJOTE line survey and the data-analysis procedure are provided in Cernicharo et al. (2021b). Observations were carried out at the cyanopolyyne peak of TMC-1 (αJ2000 = 04h:41m:41.9s, δJ2000 = 25o:41′:27.0′′).
The Yebes 40 m survey was performed in several sessions between 2019 and 2024, using new receivers built within the Nanocosmos project1 (Tercero et al. 2021). The Q-band receiver consists of two cold high-electron-mobility transistor (HEMT) amplifiers that cover the 31.0–50.3 GHz (7 mm) Q band with horizontal and vertical polarizations. Fast Fourier transform spectrometers (FFTSs) with 8×2.5 GHz bandwidth and a spectral resolution of 38.15 kHz (∼0.27 km s−1) were used. The observational mode was frequency-switching with frequency throws of either 10 or 8 MHz. In addition, different central frequencies were used during the runs to ensure that no spurious spectral ghosts were produced in the down-conversion chain. The total observing time on the source for the data taken with the frequency throws of 10 and 8 MHz is 772.6 and 736.6 hours, respectively. Hence, the total observing time on the source is 1509.2 hours. The QUIJOTE sensitivity varies between 0.06 at 32 and 0.18 mK at 49.5 GHz (Cernicharo et al. 2024c).
The observations from the IRAM 30 m telescope, located in Pico Veleta (Granada, Spain), were carried out using frequency-switching observing mode with a frequency throw of 7.14 MHz (Cernicharo et al. 2012; Marcelino et al. 2023; Cernicharo et al. 2024a), the broadband EMIR (E090) receiver covering the frequency range 71.6–117.6 GHz, and the FFTSs with 48 kHz spectral resolution. Observations were performed in several runs between 2012 and 2021. Each frequency setup was observed for ∼2 h, with pointing checks in between on strong and nearby quasars. Pointing errors were always within 3′′.
The intensity scale in antenna temperature  , corrected for atmospheric absorption and for antenna ohmic and spillover losses, was calibrated using two absorbers at different temperatures as well as the atmospheric transmission model (ATM; Cernicharo 1985; Pardo et al. 2025). The absolute calibration uncertainty is 9%. The data were reduced and processed by using the CLASS package provided within the GILDAS software2, developed by the IRAM Institute.
3 Results
Regarding linear (l-) isomers, we detected for the first time in the ISM two rotational transitions in band Q of l-H2C3O (40,4–30,3 and 50,5–40,4), with Eu=4.3 and 6.4 K, respectively. These transitions have the same frequency for both the unresolved ortho(o-) and para(p-). We used the Cologne Database for Molecular Spectroscopy (CDMS, Müller et al. 2001, 2005; Endres et al. 2016) and the MADEX catalogue (Cernicharo 2012), which considers spectroscopic laboratory data for propadienone from Brown et al. (1981). The lines exhibit antenna temperatures of 0.44 and 0.56 mK, as well as line-widths of 0.54–1.1 km s−1, similar to those found for other sulphur species in TMC-1 (e.g. Cernicharo et al. 2024b; Agúndez et al. 2025; Esplugues et al. 2025). Figure A.13 shows the observed line profiles (black lines) of l-H2C3O. See also Table A.1, which lists the line parameters obtained from Gaussian fits of the detected lines. We also detected eleven lines of HCCCHO (Fig. A.11); one line of its isotopologue, H13CCCHO (Fig. A.12); and another line of HC13CCHO (Fig. A.13). Spectroscopy laboratory data for HCC-CHO and its isotopologues were taken from Jabri et al. (2020) and McCarthy et al. (2020). For the S counterpart, we detected seven lines of o-H2C3S (Fig. A.7) and three lines of p-H2C3S (Fig. A.8), with Eu ranging from 6.5 K to 10.9 K, and linewidths ranging from 0.58–0.77 km s−1 (Table A.1). Spectroscopy laboratory data for linear H2C3S were taken from Brown et al. (1988). These detections rely on longer observational time than the original detection by Cernicharo et al. (2021c); therefore, the data shown in this paper (Tables 1, 2, and A.1) should be considered as the reference data for this molecule.
Regarding cyclic (c-) isomers, we detected (Table A.1) six lines of o-c-H2C3O (Fig. A.2), three lines of p-c-H2C3O (Fig. A.3), seven lines of o-c-H2C3S (Fig. A.9), and three lines of p-c-H2C3S (Fig. A.10), with Eu ranging from 3.2 to 17.2 K. They all were observed at 7 mm, except for four lines of o-c-H2C3O that were detected at 3 mm. Spectroscopy laboratory data for c-H2C3O were taken from Müller et al. (2021), and for c-H2C3S from Remijan et al. (2025). The lines exhibit antenna temperatures between 0.32 and 23.6 mK (with lines from c-H2C3O being significantly more intense than those from c-H2C3S). Linewidths range from 0.49 to 0.91 km s−1. The c-H2C3O lines are not blended with other species; however, four lines of c-H2C3S are contaminated by emission from other molecules (see Table A.1). This blending of lines for intensities below 1 mK should be be considered as a warning for blind statistical stacking detection methods. We also detected for the first time in the ISM the deuterated molecule c-HDC3O by observing two rotational lines (see Table A.1 and Fig. A.4, indicating c-HDC3O lines with Eu<15 K and Aul >10−6 s−1). For c-H2C3O, we also detected some isotopologues (using spectroscopy laboratory data from Müller et al. 2021). In particular, we observed two lines of c-H213 CCCO (30,3-20,2 and 31,2-21,1; see Fig. A.5) above 3.5σ without contamination from any other spectral feature. We also detected for the first time one line from c-H2CC13CO (61,5-51,4; see Fig. A.6). However, since it is the only one detected, and its line intensity is ∼3σ, we considered it a tentative detection.
Obtained column densities, N (cm−2), and abundances (X).
OPRs for carbon chain molecules.
3.1 Rotational diagrams
For the molecules with more than two detected lines, we computed a representative rotational temperature (Trot) by constructing a rotational diagram, assuming a single rotational temperature for all the energy levels (Goldsmith & Langer 1999). The resulting rotational diagrams are shown in Fig. A.14, and the obtained rotational temperatures (with the uncertainties obtained from the least-squares fit) are listed in Table 1. We did not apply the rotational diagram method to c-HDC3O, since we had only two rotational transitions. Therefore, for c-HDC3O, we assumed the Trot obtained for o-c-H2C3O. For the isotopo-logue c-H213 CCCO (with two detected lines), we also adopted the Trot from o-c-H2C3O. Since we only observed one line for H13CCCHO and HC13CCHO, we adopted Trot from HCCCHO. Since only one line (60,6-50,5) of p-c-H2C3S is >4σ and is not blended, we assumed the same Trot than that derived for o-c-H2C3S.
Most rotational temperatures range from 4.8–6.5 K. Only o-c-H2C3S and HCCCHO have slightly higher values (∼8 K), but large uncertainties (Fig. A.14). We also note that lines of o-c-H2C3S (53,3-43,2 and 53,2-43,1) are blended with the hyperfine structure (hfs) of H13CCNC, which increases the uncertainty on the fitted Trot.
3.2 Column densities and abundances
In order to calculate the column densities of the observed H2C3O and H2C3S isomers, we used the MADEX code assuming LTE (Local Thermodynamic Equilibrium) at the rotational temperatures derived above due to the lack of collisional rates. In our case, we used the Trot from the transition analysis listed in Table 1. The use of this code allows us to compare the synthetic line profiles with observed ones.
The MADEX code provides antenna temperature intensities for each line after taking the different telescope beams and efficiencies into account. We assumed a diameter size of 80′′ (Fossé et al. 2001), compatible with the emission size of most of the molecules mapped in TMC-1 (Cernicharo et al. 2023). For each molecule, we considered the average value of linewidths obtained from the Gaussian fits (Table A.1). We left the column density as the only free parameter. Figures A.1–A.13 show the synthetic spectra from the LTE models in red, overlaid with the observed line profiles (black). The derived column densities (with estimated errors of ∼20%) are listed in Table 1. Abundances for each molecule, also shown in Table 1, were derived considering an H2 column density of 1022 cm−2 for TMC-1 (Cernicharo & Guelin 1987). For those species that were undetected (e.g. H13CCCHO), or for which only detected one line (e.g. o-c-H2CC13 CO), we provided upper limits. To derive these upper limits for each species, once the physical parameters were fixed, we varied the column density until the model fit reached the intensity peak of any observed line. We did not allow the model fit to be greater than any observed line.
4 Discussion
We detect for the first time in space propadienone (l-H2C3O). This is the most stable isomer of H2C3O, with the lowest binding energy among them (Loomis et al. 2015). However, despite this, it remained undetected until now. In particular, we have derived its abundance to be 3.7×10⁻¹². The abundances derived for c-H2C3O and HCCCHO are 3.2×10⁻¹¹ and 9.2×10⁻¹¹, respectively. This implies that propadienone is one order of magnitude less abundant than c-H2C3O and HCCCHO. Nevertheless, this is not the first case where the least stable isomers were detected first and exhibited higher abundances than the most stable ones (see e.g. Brünken et al. 2009; Marcelino et al. 2010; Halfen et al. 2009; Esplugues et al. 2024), suggesting that kinetic effects have a more important role than thermodynamic effects on the chemical formation pathways of these isomers. It therefore highlights the importance of knowing the formation path of the different isomers independently of their relative energies. The principle of minimum energy (Lattelais et al. 2009) does not hold under all conditions of interstellar clouds.
Particularly interesting is the comparison between H2C3S and its oxygen analogue H2C3O, given that oxygen and sulphur share similar electron configurations. While we derived an abundance of X=3.7×10⁻¹² for l-H2C3O, we obtained X(l-H2C3 S)=7.3×10⁻¹¹ (Table 1) for its sulphur counterpart, i.e. l-H2C3S is about twenty times more abundant than l-H2C3O. By contrast, we obtained the opposite trend for the cyclic isomers, with abundances of 3.2×10⁻¹¹ and 4.8×10⁻¹² for c-H2C3O and c-H2C3S, respectively. This means that the oxygen cyclic isomer is about seven times more abundant than the sulphur cyclic one. For the other linear isomers, HCCCHO and HCCCHS, we also find that the oxygen one is about three times more abundant than the sulphur one. These results suggest that, for the metastable isomers, those containing oxygen are more abundant than their sulphur analoguess. However, for the stable isomers, the opposite trend is found.
4.1 Isotopic fractionation
We also detected for the first time in space the isotopo-logue c-H213 CCCO, with the clear observation of two transitions (above 3.5σ). We derived N(c-H213 CCCO)=(1.4±0.3) ×1010 cm−2, which implies 12C/13C=23±9. For c-H2CC13CO, we only detected one transition; therefore, as previously stated, we considered it a tentative detection, with N(c-H2CC13CO)<(5.6±1.1)×1010 cm−2. For the case of propynal, we did not detected any 13C isotopologue; however, we provided upper limits (Table 1) instead. From these results, we derived a HCCCHO/H13CCCHO ratio >20.9 in agreement with the result obtained for the c-H2 C3O/c-H2 13CCCO ratio. These 12C/13C values are significantly different from that of the Solar System value (12C/13C=89, Wilson & Rood 1994) and from the standard value of ∼70 in the local ISM (e.g. Wilson & Rood 1994; Ritchey et al. 2011). Comparing with recent results found for TMC-1, Tercero et al. (2024) obtained 12C/13C∼69–106 using HCCCN and deduced a clear fractionation for the species with the 13C isotope adjacent to nitrogen. Cernicharo et al. (2024d) obtained 12C/13C∼88–94 and ∼93–100 though the isomers HNCCC and HCCNC, respectively, but without finding any isotopic fractionation trend depending on the 13C position. This suggests chemical differences in the processes governing isotopic fractionation for isomerism. Also in TMC-1, Navarro-Almaida et al. (2023) obtained significantly low 12C/13C values (16-23) using HCN and H13CN. These values are similar to those deduced by Daniel et al. (2013) (∼20–30) and Magalhães et al. (2018) (∼45) using the same molecules, as well as HNC and CN, towards the pre-stellar core B1 b and the starless core L 1498, respectively. Nevertheless, these molecules are likely affected by opacity effects, which strongly impact the derivations of column densities and may lead to an underestimation of the main isotope column density, and thus of the 12C/13C ratios. Lines of o-c-H2C3O are, however, optically thin, suggesting that it is enriched in 13C in TMC-1. C fractionation and, in particular, 13C enhancement in dense interstellar clouds have been studied through observations and distinct time-dependent chemical models (e.g. Langer et al. 1984; Langer & Penzias 1990; Furuya et al. 2011; Roueff et al. 2015). In particular, Langer et al. (1984) introduced different isotopic exchange reactions in their model, suggesting that C fractionation in the ISM results from the chemical reaction,
 (1)
(1)
and concluded that the lower the temperature, the higher the chemical fractionation of C-bearing species. It was also deduced that when CO molecules become the main reservoir of carbon, although the 13C concentration is low, reaction (1) still leads to a small 13CO enrichment (Langer & Penzias 1990; Milam et al. 2005), while other carbon-containing species (for instance, CH and other carbon chains) become depleted in 13C. This was also found by Roueff et al. (2015) when studying C fractionation for C, CH, CO, and HCO+. They found that HCO+ is marginally enriched in 13C at steady state, whereas HCN and HNC are significantly depleted in 13C. These results show how the 12C/13C ratio can vary among different chemical species.
In this paper, we also report the detection of the deuterated version of cyclopropenethione, i.e. c-HDC3O, with N=2.6×1010 cm−2. It implies an H/D ratio of 12±5. This result is similar to the ratios found in TMC-1 for CH3CN/CH2DCN=11, CH3CCH/CH2DCCH=10, and H2CCN/HDCCN=20 (Cabezas et al. 2021). However, it also significantly differs from other H/D ratios, such as C4H/C4D=118 (Cabezas et al. 2021) and HC5N/DC5N=82 (Cernicharo et al. 2020a) obtained from TMC-1. Nevertheless, theoretical chemical models predict that the H/D values for these two ratios are ∼20–55 (Cabezas et al. 2022), which agree better with our results. In any case, a more comprehensive deuteration study of large carbon-chain molecules should be carried out in order to understand the large H/D observational differences between similar species of the same region.
4.2 The ortho-to-para ratio
Molecular hydrogen (H2) has two nuclear spin isomers, ortho and para, in which the two nuclear spins of protons are parallel and antiparallel, respectively. The ortho-to-para ratio (OPR) is known to affect chemical evolution as well as gas dynamics in space (e.g. Faure et al. 2019; Tsuge et al. 2021; Yocum et al. 2023). In thermodynamic equilibrium, OPR (with a statistical weight value of 3) is determined by the reaction heat released compared to the energy difference between the lowest ortho and para states (Minh et al. 1991). If molecules are produced with excess energy by ion-molecule reactions, the ratio is expected to be that of the statistical weight (Kawaguchi et al. 1991). Nevertheless, factors related to formation processes, such as the spin state of precursor molecules and the structure of the reaction energy surface, might constrain the OPR to a non-equilibrium value.
In this paper, we report several ortho- and para- transitions of the cyclic isomers c-H2C3O and c-H2C3S, and of the linear isomer l-H2C3S (Table A.1). In particular, we obtained OPRs of 2.7±1.0 and 4.0±1.6 for c-H2C3O and c-H2C3S, respectively, and OPR(H2C3S) = 4.6±1.9, in agreement with that found by Cernicharo et al. (2021c) (see Table 2). These OPRs are compatible with the 3/1 value expected from the statistical spin degeneracies. Comparing with other OPR from carbon chain molecules in TMC-1, the obtained OPR values for H2CCS and c-C3H2 are 3.3±0.7 and 3.2±0.3, respectively (Cernicharo et al. 2021a,c). Similar values were also found for other sulphur carbon molecules in a sample of starless cores at Taurus and Perseus, such as OPR(H2CS) = 2.4±0.9 (Esplugues et al. 2022).
4.3 Chemical modelling
To carry out a theoretical study of the chemistry involved in the formation and destruction of the isomers of H2C3O and H2C3S, we used a model based on the Nautilus code (Ruaud et al. 2016), a three-phase (gas, dust grain ice surface, and dust grain ice mantle) time-dependent chemical model employing kida.uva.2024 (Wakelam et al. 2024) as the basic reaction network. This model was recently updated for a better description of COM (Complex Organic Molecules) chemistry on interstellar dust grains and in the gas-phase (Manigand et al. 2021; Coutens et al. 2022). There are 800 individual species included in the network that are involved in approximately 9000 separate reactions. Elements are either initially in their atomic or ionic forms in this model (elements with an ionisation potential <13.6 eV are considered to be fully ionised), and the C/O elemental ratio is equal to 0.71 in this work. The initial simulation parameters are the same as those in Table 4 of Hickson et al. (2024) except for the initial oxygen atom, for which we used a depleted abundance (O/H=1.4×10−4), and for Sulphur (S+/H=3.0×10−6), giving much better results. The grain surface and the mantle are both chemically active for these simulations, while accretion and desorption were only allowed between the surface and the gas-phase. The dust-to-gas ratio (in terms of mass) is 0.01. A sticking probability of 1 was assumed for all neutral species while desorption occurs by both thermal and non-thermal processes (cosmic rays, chemical desorption) including sputtering of ices by cosmic-ray collisions (Wakelam et al. 2021).
The chemistry of H2C3O isomers, including c-H2C3O, was reviewed in Loison et al. (2016), but the chemistry for H2C3S was not. Here, we complement that study by reviewing the chemistry of H2C3S isomers, as well as the chemistry of carbon chains in clouds, in relation to the sulphur chemistry studies by Loison et al. (2016) and Vidal et al. (2017). In our current chemical network, propynal (HCCCHO) is produced efficiently in the gas phase through the O + C3H3 reaction, while cyclopropenone (c-H2C3O) is produced relatively efficiently through the OH + c-C3H2 reaction. For propadienone (l-H2C3O), a production pathway is the OH + t-C3H2 reaction, as in Lee et al. (2006) and Loison et al. (2016). Even if this last reaction is limited by the low t-C3H2 abundance, the detection of l-H2C3O is a potential proxy for estimating the abundance of t-C3H2. However, another potential production pathway for l-H2C3O production, as well as the other H2C3O isomers, is the dissociative electron recombination (DR) of HCCCHOH+ and C2H3CO+. These two ions are produced by the protonation of H2C3O isomers, with C2H3CO+ also being produced by the radiative association of  (Herbst et al. 1984; Scott et al. 1995; Maclagan et al. 1995). These DR were neglected as H2C3O isomers pathways in Loison et al. (2016) in favour of the production of C2H2 + CO. Indeed, given the very high exothermicity of DR (431 kJ/mol for the C2H3CO+ + e− → H2C3O + H, and 558 kJ/mol for the HCCCHOH+ + e− → HCCCHO + H), H2C3O isomers will be produced partly above their isomerisation barriers and also above their dissociation barriers as shown in Fig. 1. In this diagram, we do not show the HCCHCO species, which is a fourth isomer that is much less stable, possessing a very shallow potential well that easily yields C2H2 + CO. It is involved in the dissociation of l-H2C3O and c-H2C3O. In the current version of our chemical model, the main route of evolution of the H2C3O isomers produced through the DR of HCCCHOH+ and C2H3CO+ is the dissociation into C2H2 + CO. However, an experimental study of the branching ratio of HCCCHOH+ and C2H3CO+ is necessary. These production routes are necessarily in the minority for HCCCHO and c-H2C3O, but may not be so for l-H2C3O. Indeed, a branching ratio of 5% is competitive for the production of l-H2C3O compared to the OH + t-C3H2 pathway.
Although the chemistry of H2C3S isomers might show similarities to that of H2C3O, there are also many differences among them. HCCCHS is produced mainly and efficiently by the S + C3H3 similar to HCCCHO. However, the production pathways of l-H2C3S and c-H2C3S differ from those of oxygenated analogues because the abundance of SH is much lower than that of OH. Therefore, SH + C3H2 reactions are not very efficient even though the SH + c-C3H2 reaction is a pathway for producing c-H2C3S (Remijan et al. 2025). Ionic chemistry is more effective at producing l-H2C3S and c-H2C3S than oxygenated equivalents. This is partly because the abundance of S+ is much higher than the abundance of O+, and the reactions S+ + CH3CCH and S+ + CH2CCH2 efficiently produce C2H3CS+ (Smith et al. 1988; Decker et al. 2001). Furthermore, the CS bond energy is lower than the CO bond energy. Therefore, the pathway leading to C2H2 + CS is less favoured during the DR of C2H3CS+ than C2H2 + CO during the DR of C2H3CO+ (see Figs. 1 and 2). Another minor but sulphur-specific pathway in the gas phase for l-H2C3S production is the CH3 + C2S reaction. The oxygenated equivalent, CH3 + C2O, is certainly just as fast at low temperatures, but preferentially produces C2H3 + CO. The differences in the production efficiency of H2C3S compared to H2C3O clearly explain their respective abundances and the fact that H2C3S is significantly more abundant than H2C3O. As with oxygenated equivalents, the branching ratios of the DR of C2H3CS+ and HCCCHSH+ (whose DR rates are shown in Table A.2) are unknown. The lack of knowledge about these branching ratios leads to considerable uncertainty about the modelled abundances of l-H2C3S and c-H2C3S.
Comparisons between our model and the various measurements for the H2C3O and H2C3S isomers is shown in Fig. 3. There is good overall agreement given the many uncertainties. This is particularly critical for l-H2C3O, l-H2C3S, and c-H2C3S, where the DRs are potentially very significant but for which no experimental or theoretical data exist. The detection of l-H2C3O, which is the least abundant of the isomers despite being the most stable, completes the description of the H2C3O/H2C3S systems. This once again highlights that chemistry is controlled by kinetics rather than thermodynamics, although knowing the rates and branching ratios of the reactions involved in interstellar modelling is also crucial. It should be noted that the abundances of the H2C3O and H2C3S isomers are controlled by kinetics but with very different formation pathways for each isomer. Consequently, it is not a good example of the relative dipole principle (RDP) (Shingledecker et al. 2020) because the chemistries of the various isomers are too different. Indeed, even though their dipole moments are different, which affects the rate of destruction by ion-molecule ionisation and protonation reactions (with  , HCO+, and C+), these differences in rates are relatively small compared with the large differences in their formation pathways. Furthermore, destruction reactions with neutrals such as atomic carbon and likely also with the OH radical are also important destruction reactions that are, a priori, similar for all isomers.
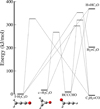 |
Fig. 1 Simplified diagram (without HCCHCO) of potential energy for H2C3O isomers calculated at the M06-2X/AVTZ level. |
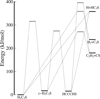 |
Fig. 2 Diagram of potential energy for H2C3S isomers calculated at the M06-2X/AVTZ level. |
5 Conclusions
We reported the first detection of propadienone (l-H2C3O) in the ISM, as well as the deuterated (c-HDC3O) and 13C substitutions of cyclopropenone, through the highly sensitive QUIJOTE spectral line survey in TMC-1. Our analysis reveals that l-H2C3O is the least abundant isomer of this species, despite being the most stable. In particular, it is about one order of magnitude less abundant than the other two isomers (c-H2C3O and HCC-CHO) and about twenty times less abundant than its sulphur analogue l-H2C3S. Chemical models also indicate that the chemistry responsible for the formation of the H2C3O and H2C3S isomers is very different, with the DR being the main production pathway for H2C3O, while H2C3S is mainly formed through gas phase ion-molecule chemistry.
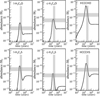 |
Fig. 3 Abundances of H2C3O and H2C3S isomers as a function of time predicted by our models with n(H2)=2×104 cm−3. The horizontal rectangles represent the observed abundances of HCCCHO (Cernicharo et al. 2020b), c-H2C3O (Cernicharo et al. 2020b), l-H2C3O (this work), HCCCHS (Cernicharo et al. 2021c), c-H2C3S (Remijan et al. 2025), H2C3S (Cernicharo et al. 2021c). The vertical rectangle represents the chemical age given by minimizing the difference between the observations for TMC-1 and the model for 62 species (Wakelam et al. 2006). |
Acknowledgements
This work was based on observations carried out with the Yebes 40 m telescope (projects 19A003, 20A014, 20D023, 21A011, 21D005, and 23A024) and the IRAM 30 m telescope. G.E., N.M., and B.T. acknowledge support from the Spanish grant PID2022-137980NB-I00, funded by MCIN/AEI/10.13039/501100011033/FEDER UE. We acknowledge funding support from Spanish Ministerio de Ciencia e Innovación through grants PID2022-136525NA-I00 and PID2023-147545NB-I00. G.E. acknowledges the ERC project SUL4LIFE (grant agreement No101096293) from European Union. G.M. acknowledges the support of the grant RYC2022-035442-I funded by MICIU/AEI/10.13039/501100011033 and ESF+. G.M. also received support from project 20245AT016 (Proyectos Intramurales CSIC).
References
- Adande, G. R., Halfen, D. T., Ziurys, L. M., Quan, D., & Herbst, E. 2010, ApJ, 725, 561 [NASA ADS] [CrossRef] [Google Scholar]
- Agúndez, M., Molpeceres, G., Cabezas, C., et al. 2025, A&A, 693, L20 [NASA ADS] [CrossRef] [EDP Sciences] [Google Scholar]
- Brown, R. D., Godfrey, P. D., Champion, R., & McNaughton, D. 1981, J. Am. Chem. Soc., 103, 5711 [Google Scholar]
- Brown, R. D., Dyall, K. G., Elmes, P. S., Godfrey, P. D., & McNaughton, D. 1988, J. Am. Chem. Soc., 110, 789 [Google Scholar]
- Brünken, S., Gottlieb, C. A., McCarthy, M. C., & Thaddeus, P. 2009, ApJ, 697, 880 [CrossRef] [Google Scholar]
- Cabezas, C., Endo, Y., Roueff, E., et al. 2021, A&A, 646, L1 [NASA ADS] [CrossRef] [EDP Sciences] [Google Scholar]
- Cabezas, C., Fuentetaja, R., Roueff, E., et al. 2022, A&A, 657, L5 [NASA ADS] [CrossRef] [EDP Sciences] [Google Scholar]
- Cabezas, C., Vávra, K., Molpeceres, G., et al. 2025, A&A, 698, L24 [NASA ADS] [CrossRef] [EDP Sciences] [Google Scholar]
- Cernicharo, J. 1985, Internal IRAM Report (Granada: IRAM) [Google Scholar]
- Cernicharo, J. 2012, EAS Pub. Ser., 58, 251 [CrossRef] [EDP Sciences] [Google Scholar]
- Cernicharo, J., & Guelin, M. 1987, A&A, 176, 299 [NASA ADS] [Google Scholar]
- Cernicharo, J., Marcelino, N., Roueff, E., et al. 2012, ApJ, 759, L43 [NASA ADS] [CrossRef] [Google Scholar]
- Cernicharo, J., Marcelino, N., Agúndez, M., et al. 2020a, A&A, 642, L8 [NASA ADS] [CrossRef] [EDP Sciences] [Google Scholar]
- Cernicharo, J., Marcelino, N., Agúndez, M., et al. 2020b, A&A, 642, L17 [NASA ADS] [CrossRef] [EDP Sciences] [Google Scholar]
- Cernicharo, J., Agúndez, M., Cabezas, C., et al. 2021a, A&A, 649, L15 [NASA ADS] [CrossRef] [EDP Sciences] [Google Scholar]
- Cernicharo, J., Agúndez, M., Kaiser, R. I., et al. 2021b, A&A, 652, L9 [NASA ADS] [CrossRef] [EDP Sciences] [Google Scholar]
- Cernicharo, J., Cabezas, C., Agúndez, M., et al. 2021c, A&A, 648, L3 [NASA ADS] [CrossRef] [EDP Sciences] [Google Scholar]
- Cernicharo, J., Cabezas, C., Endo, Y., et al. 2021d, A&A, 650, L14 [NASA ADS] [CrossRef] [EDP Sciences] [Google Scholar]
- Cernicharo, J., Cabezas, C., Endo, Y., et al. 2021e, A&A, 646, L3 [NASA ADS] [CrossRef] [EDP Sciences] [Google Scholar]
- Cernicharo, J., Fuentetaja, R., Cabezas, C., et al. 2022, A&A, 663, L5 [NASA ADS] [CrossRef] [EDP Sciences] [Google Scholar]
- Cernicharo, J., Tercero, B., Marcelino, N., Agúndez, M., & de Vicente, P. 2023, A&A, 674, L4 [NASA ADS] [CrossRef] [EDP Sciences] [Google Scholar]
- Cernicharo, J., Agúndez, M., Cabezas, C., et al. 2024a, A&A, 682, L4 [NASA ADS] [CrossRef] [EDP Sciences] [Google Scholar]
- Cernicharo, J., Cabezas, C., Agúndez, M., et al. 2024b, A&A, 688, L13 [NASA ADS] [CrossRef] [EDP Sciences] [Google Scholar]
- Cernicharo, J., Cabezas, C., Fuentetaja, R., et al. 2024c, A&A, 690, L13 [NASA ADS] [CrossRef] [EDP Sciences] [Google Scholar]
- Cernicharo, J., Tercero, B., Cabezas, C., et al. 2024d, A&A, 682, L13 [NASA ADS] [CrossRef] [EDP Sciences] [Google Scholar]
- Coutens, A., Loison, J. C., Boulanger, A., et al. 2022, A&A, 660, L6 [NASA ADS] [CrossRef] [EDP Sciences] [Google Scholar]
- Daniel, F., Gérin, M., Roueff, E., et al. 2013, A&A, 560, A3 [NASA ADS] [CrossRef] [EDP Sciences] [Google Scholar]
- Decker, B. K., Adams, N. G., & Babcock, L. M. 2001, Int. J. Mass Spectr., 208, 99 [Google Scholar]
- Endres, C. P., Schlemmer, S., Schilke, P., Stutzki, J., & Müller, H. S. P. 2016, J. Mol. Spectr., 327, 95 [NASA ADS] [CrossRef] [Google Scholar]
- Esplugues, G., Fuente, A., Navarro-Almaida, D., et al. 2022, A&A, 662, A52 [NASA ADS] [CrossRef] [EDP Sciences] [Google Scholar]
- Esplugues, G., Rodríguez-Baras, M., San Andrés, D., et al. 2023, A&A, 678, A199 [NASA ADS] [CrossRef] [EDP Sciences] [Google Scholar]
- Esplugues, G., Rodríguez-Baras, M., Navarro-Almaida, D., et al. 2024, A&A, 692, A5 [NASA ADS] [CrossRef] [EDP Sciences] [Google Scholar]
- Esplugues, G., Agúndez, M., Molpeceres, G., et al. 2025, A&A, 699, L2 [NASA ADS] [CrossRef] [EDP Sciences] [Google Scholar]
- Faure, A., Hily-Blant, P., Rist, C., et al. 2019, MNRAS, 487, 3392 [Google Scholar]
- Fossé, D., Cernicharo, J., Gerin, M., & Cox, P. 2001, ApJ, 552, 168 [Google Scholar]
- Fuente, A., Esplugues, G., Rivière-Marichalar, P., et al. 2025, ApJ, 986, L17 [Google Scholar]
- Furuya, K., Aikawa, Y., Sakai, N., & Yamamoto, S. 2011, ApJ, 731, 38 [Google Scholar]
- Goldsmith, P. F., & Langer, W. D. 1999, ApJ, 517, 209 [Google Scholar]
- Halfen, D. T., Ziurys, L. M., Brünken, S., et al. 2009, ApJ, 702, L124 [NASA ADS] [CrossRef] [Google Scholar]
- Herbst, E., Smith, D., & Adams, N. G. 1984, A&A, 138, L13 [NASA ADS] [Google Scholar]
- Hickson, K. M., Loison, J.-C., & Wakelam, V. 2024, ACS Earth Space Chem., 8, 1087 [Google Scholar]
- Hollis, J. M., Remijan, A. J., Jewell, P. R., & Lovas, F. J. 2006, ApJ, 642, 933 [Google Scholar]
- Irvine, W. M., Brown, R. D., Cragg, D. M., et al. 1988, ApJ, 335, L89 [Google Scholar]
- Jabri, A., Kolesniková, L., Alonso, E. R., et al. 2020, J. Mol. Spectr., 372, 111333 [Google Scholar]
- Kawaguchi, K., Kaifu, N., Ohishi, M., et al. 1991, PASJ, 43, 607 [NASA ADS] [Google Scholar]
- Komornicki, A., Dykstra, C. E., Vincent, M. A., & Radom, L. 1981, J. Am. Chem. Soc., 103, 1652 [Google Scholar]
- Langer, W. D., & Penzias, A. A. 1990, ApJ, 357, 477 [Google Scholar]
- Langer, W. D., Graedel, T. E., Frerking, M. A., & Armentrout, P. B. 1984, ApJ, 277, 581 [Google Scholar]
- Lattelais, M., Pauzat, F., Ellinger, Y., & Ceccarelli, C. 2009, ApJ, 696, L133 [Google Scholar]
- Lee, H., Nam, M.-J., & Choi, J.-H. 2006, J. Chem. Phys., 124, 044311 [Google Scholar]
- Loison, J.-C., Agúndez, M., Marcelino, N., et al. 2016, MNRAS, 456, 4101 [Google Scholar]
- Loomis, R. A., McGuire, B. A., Shingledecker, C., et al. 2015, ApJ, 799, 34 [Google Scholar]
- Maclagan, R. G. A. R., McEwan, M. J., & Scott, G. B. I. 1995, Chem. Phys. Lett., 240, 185 [Google Scholar]
- Magalhães, V. S., Hily-Blant, P., Faure, A., Hernandez-Vera, M., & Lique, F. 2018, A&A, 615, A52 [NASA ADS] [CrossRef] [EDP Sciences] [Google Scholar]
- Manigand, S., Coutens, A., Loison, J. C., et al. 2021, A&A, 645, A53 [NASA ADS] [CrossRef] [EDP Sciences] [Google Scholar]
- Marcelino, N., Brünken, S., Cernicharo, J., et al. 2010, A&A, 516, A105 [NASA ADS] [CrossRef] [EDP Sciences] [Google Scholar]
- Marcelino, N., Puzzarini, C., Agúndez, M., et al. 2023, A&A, 674, L13 [NASA ADS] [CrossRef] [EDP Sciences] [Google Scholar]
- McCarthy, M. C., Lee, K. L. K., Carroll, P. B., et al. 2020, J. Phys. Chem. A, 124, 5170 [Google Scholar]
- Milam, S. N., Savage, C., Brewster, M. A., Ziurys, L. M., & Wyckoff, S. 2005, ApJ, 634, 1126 [Google Scholar]
- Minh, Y. C., Brewer, M. K., Irvine, W. M., Friberg, P., & Johansson, L. E. B. 1991, A&A, 244, 470 [NASA ADS] [Google Scholar]
- Müller, H. S. P., Thorwirth, S., Roth, D. A., & Winnewisser, G. 2001, A&A, 370, L49 [Google Scholar]
- Müller, H. S. P., Schlöder, F., Stutzki, J., & Winnewisser, G. 2005, J. Mol. Struc., 742, 215 [Google Scholar]
- Müller, H. S. P., Brahmi, M., A., Guillemin, J.-C., Lewen, F., & Schlemmer, S. 2021, A&A, 647, A179 [NASA ADS] [CrossRef] [EDP Sciences] [Google Scholar]
- Navarro-Almaida, D., Bop, C. T., Lique, F., et al. 2023, A&A, 670, A110 [NASA ADS] [CrossRef] [EDP Sciences] [Google Scholar]
- Pardo, J. R., De Breuck, C., Muders, D., et al. 2025, A&A, 693, A148 [NASA ADS] [CrossRef] [EDP Sciences] [Google Scholar]
- Remijan, A. J., Changala, P. B., Xue, C., et al. 2025, ApJ, 982, 191 [Google Scholar]
- Ritchey, A. M., Federman, S. R., & Lambert, D. L. 2011, ApJ, 728, 36 [NASA ADS] [CrossRef] [Google Scholar]
- Roueff, E., Loison, J. C., & Hickson, K. M. 2015, A&A, 576, A99 [NASA ADS] [CrossRef] [EDP Sciences] [Google Scholar]
- Ruaud, M., Wakelam, V., & Hersant, F. 2016, MNRAS, 459, 3756 [Google Scholar]
- Scott, G. B. I., Fairley, D. A., Freeman, C. G., Maclagan, R. G. A. R., & McEwan, M. J. 1995, Int. J. Mass Spectr. Ion Process., 149, 251 [Google Scholar]
- Shingledecker, C. N., Álvarez-Barcia, S., Korn, V. H., & Kästner, J. 2019, ApJ, 878, 80 [Google Scholar]
- Shingledecker, C. N., Molpeceres, G., Rivilla, V. M., Majumdar, L., & Kästner, J. 2020, ApJ, 897, 158 [NASA ADS] [CrossRef] [Google Scholar]
- Smith, D., Adams, N. G., Giles, K., & Herbst, E. 1988, A&A, 200, 191 [NASA ADS] [Google Scholar]
- Tercero, F., López-Pérez, J. A., Gallego, J. D., et al. 2021, A&A, 645, A37 [EDP Sciences] [Google Scholar]
- Tercero, B., Marcelino, N., Roueff, E., et al. 2024, A&A, 682, L12 [NASA ADS] [CrossRef] [EDP Sciences] [Google Scholar]
- Tsuge, M., Kouchi, A., & Watanabe, N. 2021, ApJ, 923, 71 [Google Scholar]
- Vidal, T. H. G., Loison, J.-C., Jaziri, A. Y., et al. 2017, MNRAS, 469, 435 [Google Scholar]
- Wakelam, V., Herbst, E., & Selsis, F. 2006, A&A, 451, 551 [NASA ADS] [CrossRef] [EDP Sciences] [Google Scholar]
- Wakelam, V., Dartois, E., Chabot, M., et al. 2021, A&A, 652, A63 [NASA ADS] [CrossRef] [EDP Sciences] [Google Scholar]
- Wakelam, V., Gratier, P., Loison, J. C., et al. 2024, A&A, 689, A63 [NASA ADS] [CrossRef] [EDP Sciences] [Google Scholar]
- Wilson, T. L., & Rood, R. 1994, ARA&A, 32, 191 [Google Scholar]
- Yocum, K. M., Wilkins, O. H., Bardwell, J. C., Milam, S. N., & Gerakines, P. A. 2023, ApJ, 958, L41 [NASA ADS] [CrossRef] [Google Scholar]
Quantum nunmbers are indicated in each panel included in Figures A.1–A.13. The red line indicates the LTE synthetic spectrum from a fit to the observed line profiles. The horizontal green line indicates the 1σ noise level.
Appendix A Additional tables and figures
This Appendix shows the line parameters (Table A.1) obtained from Gaussian fits of the detected lines in TMC-1 (see Sect. 3), and the rates (Table A.2) for the DR of HCCCHSH+ and C2H3+ CS (see Sect. 4.3).
Figures A.1-A.13 show the observed lines listed in Table A.1, with their quantum numbers indicated in each panel. The red line shows the LTE synthetic spectrum from a fit to the observed line profiles, and the horizontal green line indicates the 1σ noise level. Figure A.14 shows the rotational diagrams derived in Sect. 3.1.
Line parameters obtained from Gaussian fits of the detected lines in TMC-1.
Rates for the DR of HCCCHSH+ and C2H3CS+.
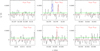 |
Fig. A.1 Observed lines of l-H2C3O for Eupp<15 K in TMC-1. |
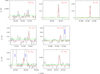 |
Fig. A.2 Observed lines of o-c-H2C3O in TMC-1 at 7 and 3 mm for Eupp≲17 K. |
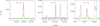 |
Fig. A.3 Observed lines of p-c-H2C3O in TMC-1 in the 31.0-50.4 GHz range. |
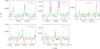 |
Fig. A.4 Observed lines of c-HDC3O for Eupp<9 K and Aul>10−6 s−1 in TMC-1 in the 31.0-50.4 GHz range. |
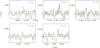 |
Fig. A.5 Observed lines of c-H213 CCCO in TMC-1 in the 31.0-50.4 GHz range. |
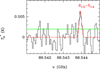 |
Fig. A.6 Observed line of c-H2CC13CO in TMC-1 in the 31.0-50.4 GHz range. |
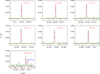 |
Fig. A.7 Observed lines of o-H2C3S in TMC-1. |
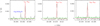 |
Fig. A.8 Observed lines of p-H2C3S in TMC-1. |
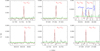 |
Fig. A.9 Observed lines of o-c-H2C3S in TMC-1. |
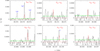 |
Fig. A.10 Observed lines of p-c-H2C3S in TMC-1 for Eupp<14 K. |
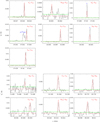 |
Fig. A.11 Observed lines of HCCCHO in TMC-1 at 7 and 3 mm. |
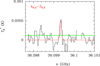 |
Fig. A.12 Observed line of H13CCCHO in TMC-1. |
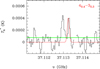 |
Fig. A.13 Observed line of HC13CCHO in TMC-1. |
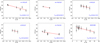 |
Fig. A.14 Rotational diagrams for o-c-H2C3O, p-c-H2C3O, o-H2C3S, p-H2C3S, o-c-H2C3S, and HCCCHO. The fitted values of the rotational temperature, Trot, and its respective uncertainty are also indicated for each molecule. |
All Tables
All Figures
|
Fig. 1 Simplified diagram (without HCCHCO) of potential energy for H2C3O isomers calculated at the M06-2X/AVTZ level. |
| In the text | |
|
Fig. 2 Diagram of potential energy for H2C3S isomers calculated at the M06-2X/AVTZ level. |
| In the text | |
|
Fig. 3 Abundances of H2C3O and H2C3S isomers as a function of time predicted by our models with n(H2)=2×104 cm−3. The horizontal rectangles represent the observed abundances of HCCCHO (Cernicharo et al. 2020b), c-H2C3O (Cernicharo et al. 2020b), l-H2C3O (this work), HCCCHS (Cernicharo et al. 2021c), c-H2C3S (Remijan et al. 2025), H2C3S (Cernicharo et al. 2021c). The vertical rectangle represents the chemical age given by minimizing the difference between the observations for TMC-1 and the model for 62 species (Wakelam et al. 2006). |
| In the text | |
|
Fig. A.1 Observed lines of l-H2C3O for Eupp<15 K in TMC-1. |
| In the text | |
|
Fig. A.2 Observed lines of o-c-H2C3O in TMC-1 at 7 and 3 mm for Eupp≲17 K. |
| In the text | |
|
Fig. A.3 Observed lines of p-c-H2C3O in TMC-1 in the 31.0-50.4 GHz range. |
| In the text | |
|
Fig. A.4 Observed lines of c-HDC3O for Eupp<9 K and Aul>10−6 s−1 in TMC-1 in the 31.0-50.4 GHz range. |
| In the text | |
|
Fig. A.5 Observed lines of c-H213 CCCO in TMC-1 in the 31.0-50.4 GHz range. |
| In the text | |
|
Fig. A.6 Observed line of c-H2CC13CO in TMC-1 in the 31.0-50.4 GHz range. |
| In the text | |
|
Fig. A.7 Observed lines of o-H2C3S in TMC-1. |
| In the text | |
|
Fig. A.8 Observed lines of p-H2C3S in TMC-1. |
| In the text | |
|
Fig. A.9 Observed lines of o-c-H2C3S in TMC-1. |
| In the text | |
|
Fig. A.10 Observed lines of p-c-H2C3S in TMC-1 for Eupp<14 K. |
| In the text | |
|
Fig. A.11 Observed lines of HCCCHO in TMC-1 at 7 and 3 mm. |
| In the text | |
|
Fig. A.12 Observed line of H13CCCHO in TMC-1. |
| In the text | |
|
Fig. A.13 Observed line of HC13CCHO in TMC-1. |
| In the text | |
|
Fig. A.14 Rotational diagrams for o-c-H2C3O, p-c-H2C3O, o-H2C3S, p-H2C3S, o-c-H2C3S, and HCCCHO. The fitted values of the rotational temperature, Trot, and its respective uncertainty are also indicated for each molecule. |
| In the text | |
Current usage metrics show cumulative count of Article Views (full-text article views including HTML views, PDF and ePub downloads, according to the available data) and Abstracts Views on Vision4Press platform.
Data correspond to usage on the plateform after 2015. The current usage metrics is available 48-96 hours after online publication and is updated daily on week days.
Initial download of the metrics may take a while.