Open Access
Fig. 15
Download original image
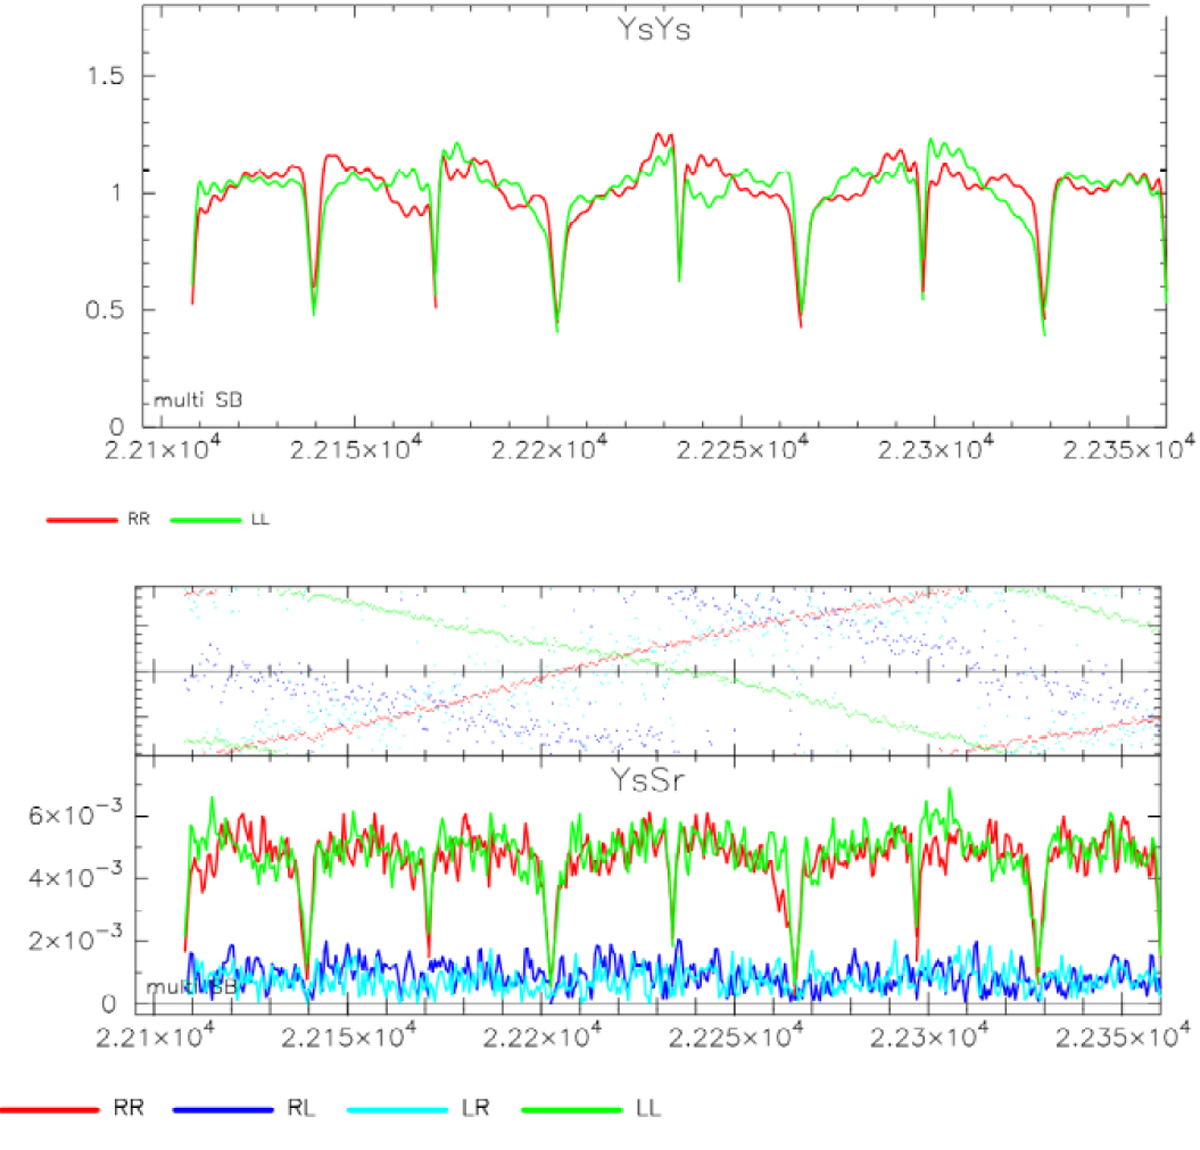
Auto-correlation and cross-correlation plots for scan 22 on source J2203+3145 that show the Yebes band-pass for every frequency channel, affected by the DBBC2 digital back-end response, and the amplitude and phase of the Yebes–Sardinia correlation showing a low level of cross-polarisation or leakage (cyan and blue curves).
Current usage metrics show cumulative count of Article Views (full-text article views including HTML views, PDF and ePub downloads, according to the available data) and Abstracts Views on Vision4Press platform.
Data correspond to usage on the plateform after 2015. The current usage metrics is available 48-96 hours after online publication and is updated daily on week days.
Initial download of the metrics may take a while.