Open Access
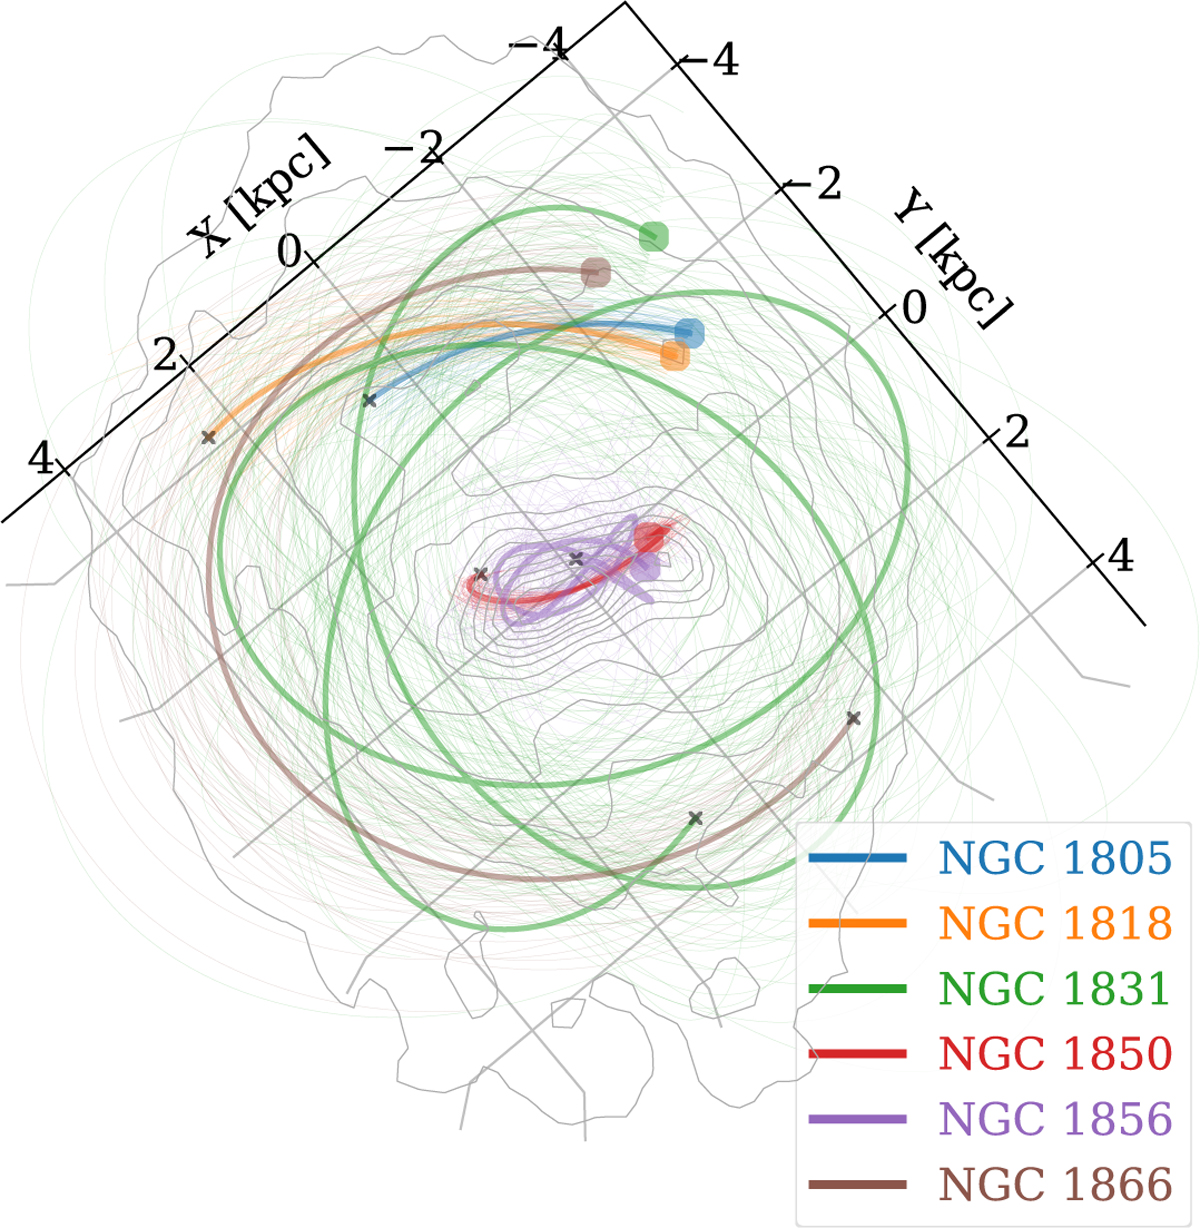
Fig. G.1
Download original image
Similar to Fig. 2 but assuming all clusters are currently located within the disc plane of the LMC. The plot is oriented such that the LMC disc is seen directly from above, and north is to the top and east to the right.
Current usage metrics show cumulative count of Article Views (full-text article views including HTML views, PDF and ePub downloads, according to the available data) and Abstracts Views on Vision4Press platform.
Data correspond to usage on the plateform after 2015. The current usage metrics is available 48-96 hours after online publication and is updated daily on week days.
Initial download of the metrics may take a while.