| Issue |
A&A
Volume 705, January 2026
|
|
|---|---|---|
| Article Number | A94 | |
| Number of page(s) | 20 | |
| Section | Galactic structure, stellar clusters and populations | |
| DOI | https://doi.org/10.1051/0004-6361/202557397 | |
| Published online | 09 January 2026 | |
Hubble Space Telescope proper motions of Large Magellanic Cloud star clusters
II. Kinematic structure of young and intermediate-age clusters
1
Leibniz-Institut für Astrophysik Potsdam,
An der Sternwarte 16,
14482
Potsdam,
Germany
2
INAF – Osservatorio di Astrofisica e Scienza dello Spazio di Bologna,
Via Gobetti 93/3,
40129
Bologna,
Italy
3
Donostia International Physics Center (DIPC),
Paseo Manuel de Lardizabal, 4,
20018
Donostia-San Sebastián, Guipuzkoa,
Spain
4
IKERBASQUE, Basque Foundation for Science,
48013
Bilbao,
Spain
5
Space Telescope Science Institute,
3700 San Martin Drive,
Baltimore,
MD
21218,
USA
6
atlanTTic, Universidade de Vigo, Escola de Enxeñaría de Telecomunicación,
36310
Vigo,
Spain
7
Universidad de La Laguna,
Avda. Astrofísico Fco. Sánchez,
38205
La Laguna, Tenerife,
Spain
8
INAF – Osservatorio Astronomico d’ Abruzzo,
Via M. Maggini,
64100
Teramo,
Italy
9
INFN – Sezione di Pisa, Università di Pisa,
Largo Pontecorvo 3,
56127
Pisa,
Italy
10
Department of Physics, University of Surrey,
Guildford
GU2 7XH,
UK
11
INAF – Osservatorio Astronomico di Padova,
Vicolo dell’Osservatorio 5,
Padova
35122,
Italy
12
Vyoma GmbH,
Karl-Theodor-Straße 55,
80803
Munich,
Germany
13
Dipartimento di Fisica e Astronomia, Università degli Studi di Bologna,
via Gobetti 93/2,
40129
Bologna,
Italy
14
Lennard-Jones Laboratories, School of Chemical and Physical Sciences, Keele University,
Keele
ST5 5BG,
UK
15
ESO, European Southern Observatory,
Karl-Schwarzschild-Str. 2,
85748
Garching bei München,
Germany
16
Aix Marseille Université, CNRS, CNES, LAM,
Marseille,
France
17
INAF – Osservatorio Astrofisico di Arcetri,
Largo E. Fermi 5,
50125
Firenze,
Italy
★ Corresponding author: This email address is being protected from spambots. You need JavaScript enabled to view it.
Received:
24
September
2025
Accepted:
17
November
2025
Abstract
In this paper, we explore the kinematic properties of a sample of 19 young (<1 Gyr) and intermediate-age (1–2.5 Gyr) massive star clusters within the Large Magellanic Cloud (LMC). We analysed the proper motions of the clusters, which have been measured based on multi-epoch Hubble Space Telescope (HST) observations. Additionally, from the HST data we inferred homogeneous and robust estimates for the distances, ages, and metallicities of the clusters. This collection of information, in combination with literature line-of-sight velocities, allowed us to investigate the full 3D dynamics of our sample of clusters within the frame of the LMC in a self-consistent way. While most young clusters orbit the LMC close to the stellar disc plane, NGC 1850 (∼100 Myr old) depicts a peculiar case. Depending on the exact distance from the disc, it follows either a highly inclined retrograde orbit or an eccentric orbit along the bar structure. The orbits of young clusters that formed north of the LMC centre show signs that might be connected to the resettling motion of the LMC bar structure. Based on the dynamic properties in combination with the positions of the clusters in the age-metallicity space, we find no clear-cut evidence of clusters in our sample that could have been stripped from the Small Magellanic Cloud (SMC) onto the LMC. Finally, we compared the kinematics of the intermediate-age clusters with a suite of simple numerical simulations of the Magellanic system to interpret the cluster motions. A possible interaction history of the LMC with the SMC, where the SMC had two past crossings of the LMC disc plane (about 300 and 900 Myr ago), in combination with the recent SMC pericentre passage, can qualitatively explain the observed kinematic structure of the clusters analysed in this work.
Key words: techniques: photometric / proper motions / stars: kinematics and dynamics / galaxies: interactions / Magellanic Clouds / galaxies: star clusters: general
© The Authors 2026
 Open Access article, published by EDP Sciences, under the terms of the Creative Commons Attribution License (https://creativecommons.org/licenses/by/4.0), which permits unrestricted use, distribution, and reproduction in any medium, provided the original work is properly cited.
This article is published in open access under the Subscribe to Open model. This email address is being protected from spambots. You need JavaScript enabled to view it. to support open access publication.
1 Introduction
On the cosmic stage, we can witness from the front row the dance of two galaxies: the Large and the Small Magellanic Clouds (LMC and SMC). The galaxies dynamically interact with each other and are in the early phases of a minor merger event. Thanks to their proximity (LMC∼50 kpc, SMC∼60 kpc; Pietrzyński et al. 2019; Graczyk et al. 2020), they provide an ideal opportunity to study, in unparalleled detail, the dynamic effects that are at play during the merging of galaxies. The two Clouds show periods of enhanced star formation (e.g. Mazzi et al. 2021; Massana et al. 2022), leading to the formation of massive star clusters (e.g. Forbes et al. 2018) that span the full cosmic age range (e.g. Horta et al. 2021). Studying the properties of these cluster populations will provide invaluable information about the formation and evolution of the Clouds as well as the origin of their system of star clusters. For example, by exploring high-resolution spectra of old (>10 Gyr) LMC clusters, Mucciarelli et al. (2021) recently discovered a peculiar chemical composition of the old LMC cluster NGC 2005 that suggests this cluster was accreted onto the LMC from a low-mass galaxy.
Studies of the full 3D kinematics of the clusters within the two galaxies, which complement the information of the ages and chemical compositions of the clusters, have so far been impeded by the availability of sufficiently precise proper motion (PM) measurements in crowded environments, such as extragalactic star clusters. Luckily, this situation has changed during the past couple of years thanks to high-precision multi-epoch space-based data, such as from the Gaia mission and the Hubble Space Telescope (HST). In a first attempt, Piatti et al. (2019a) combined PM data from the Gaia data release 2 (DR2; Gaia Collaboration 2018) catalogue with spectroscopic line-of-sight (LOS) measurements to analyse the 3D kinematic structure of the old star-cluster population of the LMC. They claim the existence of two spatially and dynamically distinct cluster populations, with some clusters showing disc-like properties and others belonging to the halo. This result contradicts the findings based on LOS velocity data alone (e.g. Freeman et al. 1983; Grocholski et al. 2006; Sharma et al. 2010), which suggest that all old clusters reside within a disc-like structure. Bennet et al. (2022) used a combination of Gaia DR3 (Gaia Collaboration 2023) and HST data to measure the bulk motion of 31 star clusters of various ages within the LMC. Their results showed no evidence of a halo population, as all of the studied clusters followed disc-like kinematics.
Massari et al. (2021) have shown that it is now feasible to measure precise stellar PMs within star clusters at the distance of the Clouds using multi-epoch HST data. Based on archival data with long temporal baselines, they determined the PMs towards the star cluster NGC 419 in the SMC. Using a similar method, in a recent work (Niederhofer et al. 2024), we presented HST-based astro-photometric catalogues of a sample of 26 star clusters within the LMC. By analysing the PM data of the young (∼100 Myr old) LMC cluster NGC 1850, we were able to distinguish the kinematics of the various stellar populations within the HST field and showed that NGC 1850 is not dynamically related to a close-by association of very young stars. In a subsequent study (Niederhofer et al. 2025), we employed these catalogues to analyse, for the first time, the chemo-dynamics of a sample of seven old LMC star clusters in a self-consistent way. We found conclusive evidence that the cluster NGC 1841 has been accreted by the LMC from a smaller galaxy based on its position in age-metallicity space and its peculiar motion within the LMC.
In this next paper of the series, we use the astro-photometric catalogues from Niederhofer et al. (202400000) to study the kinematic structure of a sample of 19 young (<1 Gyr) and intermediate-age (1–2.5 Gyr) star clusters within the LMC. Employing the isochrone fitting framework from the Cluster Ages to Reconstruct the Milky Way Assembly (CARMA) project1 (Massari et al. 2023), we self-consistently derive the ages, metallicities, and distances of the clusters. This work continues the successful method of combining dynamical information with accurate determinations of the cluster properties (age, metallicity) to investigate the evolution of the LMC based on its star cluster system.
The paper is organised as follows. In Sect. 2, we introduce the data sets we used and the compilation of the catalogues for the isochrone fitting. In Sect. 3, we describe the isochrone fitting method and present the results for our cluster sample. We present the kinematic structure of the clusters within the LMC in Sect. 4. In Sect. 5, we compare the kinematics of the intermediate-age clusters with a suite of dynamical models, and we conclude the paper in Sect. 6.
2 Data
2.1 Photometry and PM measurements
The astro-photometric catalogues presented by Niederhofer et al. (2024)2 are based on multi-epoch HST observations using the Ultraviolet-Visible (UVIS) channel of the Wide Field Camera 3 (WFC3) and the Wide-Field Channel (WFC) of the Advanced Camera for Surveys (ACS)3. To increase the sample of clusters, we supplemented these data with two additional clusters, namely NGC 1751 and NGC 1818, which have available archival long time-baseline data, suitable for PM determinations. Observation logs for NGC 1751 and NGC 1818 can be found in Tables A.1 and A.2.
The photometric and astrometric reduction of the data sets is described in detail in Niederhofer et al. (2024). The photometric measurements follow the well-established state-of-the-art methods for HST data (see Bellini et al. 2017, Bellini et al. 2018). In brief, the photometric measurements have been performed on the individual un-resampled_flc images, which have been corrected for imperfect charge transfer efficiency. We measure positions and fluxes of neighbour-subtracted sources using a first- and second-pass photometric run, based on the Fortran tools hst1pass (Anderson 2022) and KS2 (see Sabbi et al. 2016; Bellini et al. 2017, for details). We corrected the measured stellar positions for geometric distortions, applying the precise distortion solutions for WFC3/UVIS and ACS/WFC (Anderson & Bedin 2010; Bellini & Bedin 2009; Bellini et al. 2011) and transformed the corrected stellar positions to a common frame, registered on the Gaia DR3 astrometric frame (Gaia Collaboration 2023). The instrumental magnitudes have been calibrated to the Vega-system, as described in Bellini et al. (2017).
We calculated the stellar PMs relative to the bulk motions of the clusters in an iterative way, following the methods developed by Bellini et al. (2014, 2018); Libralato et al. (2018, 2022). We transformed the observed stellar positions within all exposures to a common reference frame using general six-parameter transformations, and fitted these transformed positions as a function of time with a least-squares straight line. The slopes of these lines directly correspond to the PMs of the stars. For the transformations, we initially used a sample of well-measured likely cluster members selected on a colour-magnitude diagram (CMD) and refined this selection within each iteration, excluding stars not in agreement with the motion of the cluster. After the last iteration, we applied a posteriori correction to the measured PMs to account for spatially variable systematic effects, (e.g. uncorrected charge transfer efficiency and distortion effects, see Bellini et al. 2014). To calibrate these relative PMs to absolute motions, we cross-identified sources within our catalogues with the Gaia DR3 catalogue. For each cluster, we determined as the PM zero-point the 2.5σ-clipped median PM difference between the HST and Gaia PMs. We did this for each PM component separately. The absolute motions of the clusters are then simply given by the negative values of the zero-points. Table B.1 lists the resulting absolute PMs of the star clusters.
2.2 Selection criteria
We applied several selection criteria in order to keep only well-measured likely cluster members in the input catalogues for the isochrone fitting routine. To select stars with good photometric as well as astrometric measurements, we applied the same quality cuts as in Niederhofer et al. (2024). These selections are based on the following diagnostic parameters provided by KS2: the quality-of-fit parameter (which indicates how well a source is fitted by the PSF model), the shape parameter RADXS (which describes how extended a source is with respect to the PSF model), the photometric RMS error, the isolation parameter of a source (defined as the fraction of flux within the PSF fitting aperture that comes from neighbouring sources, before neighbour subtraction), and the fraction of good measurements of a source with respect to the total number of detections. The astrometric selection criteria are based on the quality of the PM measurements and include the reduced χ2 of the PM fit, the fraction of data points of a source actually used for the determination of its PM, and the PM uncertainty.
We subsequently selected from the sample of well-measured stars those sources that likely belong to a given cluster, using the measured relative PMs of the stars. To this aim, we constructed a diagram of the relative 1D motions as a function of the mF814W magnitude (as an example, see Fig. C.1 for the selection of cluster stars of NGC 1856). Since we are considering here the relative motions, stars belonging to the cluster have PMs close to zero, whereas field stars have larger motions, due to the larger velocity dispersion of the field stars and any offset in velocity between the cluster and field stars. From this diagram, we selected (by hand) the stars that follow the bulk of the cluster stars. We opted for this procedure over a fixed cut in PM to account for the varying PM uncertainties as a function of magnitude. Furthermore, manual selection allows for higher flexibility. Panel c in Fig. C.1 illustrates that for NGC 1866, which is one of the clusters most severely affected by field-star contamination, our PM selection yields a much cleaner CMD. We note that the PM distribution of the field stars usually substantially overlaps with the PMs of the cluster stars, which results in the inclusion of field interlopers in the PM-selected catalogue at the 2% to 5% level for the different clusters. The risk of including field stars is higher at the magnitude level of the lower main-sequence, given the larger PM uncertainties there and the resulting larger overlap between cluster and field stars, but these faint stars are generally not used for isochrone fitting anyway (see Sect. 3). To refine our selection, we considered for our final catalogue only stars that are within one to two times (depending on the size of the cluster and the number of stars within the cluster and the field) the effective radius of the clusters (as determined by Niederhofer et al. 2024).
2.3 Differential reddening correction
After we defined our input lists, we corrected the photometry of each cluster for the effects of differential reddening, following the steps described by Milone et al. (2023a). This method, which we briefly recapitulate below, takes into account simultaneously the photometric information from all available filters. As a first step, we determined for each star in the catalogue of a given cluster the temperature dependent extinction coefficients, Aλ, for each filter. To calculate Aλ, we created a list of extinction coefficients across a wide range of stellar effective temperatures. We assumed a standard Cardelli et al. (1989) reddening law with RV = 3.1. Then, we overlaid a Bag of Stellar Tracks and Isochrones (BaSTI) model (Hidalgo et al. 2018; Pietrinferni et al. 2021) over the CMD of the cluster that resembles the cluster sequences, from an initial run of the isochrone-fitting algorithm (see Sect. 3). We estimated the effective temperature of each star as the temperature of the closest isochrone point in the CMD and linearly interpolated the grid of extinction coefficients to determine the Aλ values for each star.
In the next step, we selected for each cluster a sample of reference stars for the determination of the local reddening. We chose main sequence stars below the turnoff and omitted stars along the binary sequence. Then for each cluster we constructed different CMDs: mλ − mF814W versus mF814W, where λ corresponds to all broadband filters with available observations (except for F814W) for a given cluster. Within each CMD, we then determined the fiducial line of the reference stars and measured their distances from this line along the direction of the reddening vector. We did this for all CMDs and compared these distances with expectations from a grid of E(B − V) values ranging from −0.3 mag to 0.3 mag (as conservative estimates) in increments of 0.001 mag (we also used negative values for E(B − V), since the correction is relative to the mean reddening of the cluster). For each E(B − V) value, we calculated the corresponding χ2 and chose the E(B − V) value that provides the minimum χ2 as the best-fitting reddening for a given star. For clusters with observations in two filters, we constructed the CMD resulting from these two filters and estimated the reddening values of the reference stars in this single CMD from the offsets of these stars from the fiducial line in the direction of the reddening vector.
In the last step, we determined the local reddening for each star in the photometric catalogues as the 2.5σ-clipped median value of the closest 75 reference stars, excluding the target star itself. To illustrate the effect of the differential reddening correction, Fig. D.1 shows, using NGC 1751 as an example, a comparison between the un-corrected and corrected CMD of the cluster and the corresponding reddening map across the cluster field.
3 Isochrone fitting
To derive homogeneous estimates of the ages, distances and metallicities of the clusters in our sample, we took advantage of the isochrone-fitting methodology developed for the CARMA project (see Massari et al. 2023, for a detailed description of the methods and functionalities). This algorithm simultaneously determines the best-fitting values for age, [M/H], distance, and E(B − V) and assigns each value a robust uncertainty through a Bayesian statistical framework. Several studies within the CARMA project have already successfully applied the fitting code (Aguado-Agelet et al. 2025; Ceccarelli et al. 2025; Niederhofer et al. 2025), and we briefly summarise the main steps of the procedure below. As theoretical models, we adopt isochrones from the newest release of the BaSTI stellar evolution library (Hidalgo et al. 2018; Pietrinferni et al. 2021). We built two separate grids of isochrones for the fitting of the young and intermediate-age clusters, respectively, to optimally sample the age ranges covered by these clusters. The first grid spans the age range from 15 Myr to 500 Myr (in steps of 5 Myr) that we used for fitting the young clusters, and the second grid covers ages going from 500 Myr to 4 Gyr (in steps of 50 Myr) that we used for the fitting of the intermediate-age clusters. For each age, we created models with metallicities [M/H] from −2.0 dex to 0.0 dex in increments of 0.01 dex. We emphasise here that we use solar-scaled models and our final results are in terms of the global metallicity [M/H], instead of the iron abundance [Fe/H]. This way, we avoid making any assumptions about the α-element abundances of the individual clusters. It has been demonstrated (e.g. Salaris et al. 1993; Cassisi et al. 2004) that in optical filter bands, the photometric difference between solar-scaled and α-enhanced models at the same global metallicity is negligible. Thus, this approach is well justified. To incorporate the effect of interstellar reddening into the fitting routine, we created a grid of temperature-dependent extinction coefficients in the various ACS/WFC and WFC3/UVIS filters, as described in Sect. 2.3.
From the input catalogues that we constructed as described in Sect. 2.2, the isochrone fitting code selected stars within each CMD that follow the cluster sequence, i.e. excluding stars on the binary sequence, blue straggler stars and left-over field interlopers. For this, the routine constructs the mean-ridge line of the stars in the CMD, and selects all stars within 1.5–2.0 times (depending on the photometric quality of the cluster) the local colour uncertainty from the ridge line. We also applied lower and upper cuts in magnitude to the cleaned catalogue of stars in order to prevent stars on the main sequence from dominating the fitting. We optimised these limits individually for each cluster.
We performed the isochrone fitting using Gaussian priors for the distance modulus, reddening and metallicity. For the first two parameters, we adopted the values provided by Milone et al. (2023a). For the metallicity (initially assuming solar-scaled [α/Fe] mixture), we used the spectroscopic measurements, along with the associated uncertainties from Grocholski et al. (2006); Mucciarelli et al. (2006, 2008, 2011); Marino et al. (2018); Asa’d et al. (2022); and Song et al. (2021). These values provide the most robust and reliable prior information for the fitting. Some clusters in our sample, however, do not have any spectroscopically determined metallicity. For these clusters, we use estimates derived photometrically by Milone et al. (2023a), with a broad dispersion of 0.1 dex, as a conservative estimate. We did not impose any prior on the ages of the clusters, but let the code freely explore the parameter space.
For each cluster, we ran the code on all possible colour-magnitude combinations that can be constructed using the available filters that exist for that cluster. For any given CMD, we determined the best-fit solution and its uncertainties as the 50th, 16th and the 84th percentiles of the posterior distributions of the four free parameters, respectively. As an example, we show in Fig. E.1 the result of the isochrone fitting routine for NGC 1978. Shown are two different CMDs with the best-fitting isochrones (stars actually used for the fitting are highlighted in green in both CMDs), as well as the corresponding corner plots of the posterior probability distribution. Representative CMDs with the best-fitting isochrone models for the remaining clusters are presented in Fig. E.2. The final results in terms of age, metallicity, distance modulus, and reddening for each cluster were calculated as the average values from the fits to the individual CMDs, and the associated overall uncertainties were derived accounting for the upper and lower limits of the inferred quantities from all fits.
The final results of the isochrone fitting for the 19 clusters in our sample are presented in Table 1. We note that for some clusters, the algorithm provided solutions in certain filter combinations that clearly miss the cluster sequence, especially the red giant branch. This often happened for CMDs combining the F438W and F555W filters. In these cases, the code often confuses the red clump with the red giant branch due to the small difference in colour. We excluded these fits from the calculation of the final results. We also did not use observations in the F336W filter for the fitting, since for UV wavelengths, the above-mentioned equivalency between solar-scaled and α-enhanced models at the same global metallicity is not accurate anymore. There are, however, two clusters – namely NGC 1805 and NGC 1868 – for which only observations in the filters F336W and F814W exists. The isochrone fits for these two clusters (flagged with the label u in Table 1) therefore might be biased and not as accurate. For three more clusters – namely NGC 1831, NGC 2108 and NGC 2209 – the routine was not able to find a robust solution. We thus decided to fit the CMDs of these clusters (flagged with the label e in Table 1) by eye. We assigned conservative uncertainties for the estimated parameters of 0.1 dex for [M/H], 0.05 mag for E(B − V), 0.1 mag for (m−M), and 0.20 Gyr for the age. We include these five clusters in our further analysis but treat them as special cases and with caution. Since the distance to these clusters is less certain, and might be biased, the reliability of their positions within the LMC, and thus the projection of their 3D velocity vectors in the reference frame of the LMC is also reduced.
Results of the isochrone fits.
4 The kinematic structure within the LMC
The distances to the clusters that we determined through the isochrone-fitting routine allowed us – together with the on-sky positions – to obtain the 3D positions of the clusters. To collect the full 6D phase-space information (3D position and 3D velocities), we combine the PMs of the clusters with spectroscopic measurements of their LOS velocities from the literature (see Table B.1). All but two clusters (namely NGC 1805 and NGC 2108) in our sample have existing LOS velocity measurements. For these two clusters, we used measurements from the Gaia DR3 catalogue (Gaia Collaboration 2023) to derive estimates for their velocities. For NGC 1805, we found two stars within the effective radius of the cluster with measured LOS velocities that would also be consistent with being evolved cluster stars based on their photometry. These stars have velocities of 301.8 km s−1 and 301.6 km s−1 with uncertainties of 4.5 km s−1 and 3.0 km s−1, respectively. The weighted mean of these stars is 301.7 km s−1 with a mean uncertainty of 3.8 km s−14. For NGC 2108, we only found one such star (248.0±3.4 km s−1). We use these values as our best guesses for the LOS velocities of clusters during our further analysis. We note that both clusters are also in our separate sample with less accurate isochrone-fitting results.
Since LOS velocities for the clusters are taken from different literature studies, they provide a heterogeneous set of measurements. To test whether this inhomogeneity would affect our final results in a significant way, we performed the following consistency check. For the clusters in our sample, we performed the analysis presented in this work again, assuming different literature determinations for their LOS velocities. Some clusters have already multiple measurements among the studies listed in Table B.1. We complemented them with determinations from further studies (Mucciarelli et al. 2008, 2014; Sakari et al. 2017; Kamann et al. 2023, and the database of Structural Parameters of Local Group Star Clusters5). We found that different assumptions for the literature LOS velocities leave the overall kinematic structure of the clusters unaffected, making our results largely insensitive to the specific choice of the adopted LOS velocities. Moreover, the varying precisions of the different LOS measurements only marginally affect the final uncertainties of the velocity components within the LMC, since the latter are the combination of several measurement uncertainties.
4.1 Velocity and coordinate transformation
To analyse the dynamics of the clusters within the LMC, we first needed to de-project their measured positions and velocities as seen from Earth into the reference frame of the galaxy (i.e. a frame where the LMC is at rest). For this, we followed the formalism developed by van der Marel & Cioni (2001) and van der Marel et al. (2002) (see also Appendix A of Jiménez-Arranz et al. 2023, for a detailed overview of the formalism). Solving the transformation equations gave us the positions and velocities of the clusters within a right-handed orthogonal coordinate system, centred on the dynamical centre of the LMC. The system is oriented such that the X–Y plane is aligned with the disc of the LMC, and the X-axis is along the line of nodes (the line where the LMC-disc plane intersects the sky plane). The transformations require knowledge of the position, orientation, and velocity of the LMC relative to an observer. We performed the de-projection adopting the following parameters: the coordinates of the LMC dynamical centre (α0, δ0) = (79.945◦, −69.306◦), the LMC centre-of-mass PM (µαcos(δ)0, µδ,0) = (1.867, 0.314) mas yr−1, the inclination angle i = 33.5◦, and the position angle of the line-of-nodes Θ = 129.8◦. These values are from Niederhofer et al. (2022). For the distance to the LMC, we assumed 49.59 kpc (Pietrzyński et al. 2019), and for the LOS velocity we adopted a value of 262.2 km s−1 (van der Marel et al. 2002). We propagated the measurement uncertainties of the clusters trough the transformation equations and finally transformed the positions and velocities of the clusters within the LMC reference frame from the Cartesian coordinate system into cylindrical coordinates. These values are presented in Table B.2. The exact values of these quantities are defined by the specific choice of the adopted parameters of the LMC. However, adopting other parameters from the literature does not significantly affect our results.
4.2 Kinematics within the LMC
We started our analysis of the kinematic structure of the clusters by looking at the three velocity components (Vϕ, VR, VZ) as well as the vertical distance from the galaxy plane, Z, as a function of the cylindrical galactocentric radius R. This is illustrated in the four panels of Fig. 1. Panel a shows the tangential velocity component (Vϕ) of the clusters, along with two model rotation curves of the LMC, as determined by Kacharov et al. (2024). The first model (orange line) follows a pure dark-matter halo with a spherical Navarro, Frenk, & White (1997, NFW) mass profile and results from fitting axisymmetric Jeans dynamical models to stars in the Gaia DR3 catalogue with measured 3D velocities. This model suggests a virial mass of the LMC of M200 = 1.81 × 10¹¹ M⊙ (see also Kallivayalil et al. 2013; Erkal et al. 2019; Shipp et al. 2021; Vasiliev et al. 2021). The second model (green dashed line) follows a mass distribution that includes also the contribution from the stellar component of the galaxy, which is described as a triaxial bar and an axisymmetric disc. Here, Kacharov et al. (2024) fitted the LOS velocities of LMC stars, employing a Schwarzschild orbit superposition method. The model shown here assumes a mass-to-light ratio (M/L) of 1.5 M⊙/L⊙ and a total luminosity of the LMC of 1.3 × 10⁹ L⊙. While several clusters follow the predicted rotation curves from the models, the tangential velocities of most of the clusters lie below these curves. Only three young (NGC 1805, NGC 1818 and NGC 1866) and one intermediate-age cluster (NGC 1718) rotate faster than what is expected from the models. This deviation of the young clusters might be related to the resettling motion of the bar structure (see Sect. 4.3), whereas the orbit of NGC 1718 might have been influenced by a past encounter of the LMC with the SMC (see Sect. 5). Beyond R∼4 kpc, the rotational velocity of the clusters seem to decrease, a behaviour not predicted by the models. However, three of the four clusters (NGC 1831, NGC 1868, NGC 2203 and NGC 2209) that show this decline belong to the sample with the less reliable isochrone fits, and thus this feature might be spurious. The fact that shifts in the distances to these clusters of more than 3 kpc would be required to make them consistent with the models, however, points towards a real feature. Moreover, NGC 2203, the cluster with the largest deviation from the model velocity curve among the four clusters, has a reliably determined distance, supporting a decrease in rotational velocity. Also, Bennet et al. (2022) found some hints of a declining rotation curve for clusters with R≳4 kpc. Within the region of the bar (indicated as a dashed vertical line in panel a), some clusters show very small Vϕ values, suggesting that their orbits have been influenced by the stellar bar feature. The young cluster NGC 1850 represents an interesting case, since it is the only cluster in our sample with a negative tangential velocity, i.e. it is on a retrograde orbit. We analyse the orbits of the young clusters in more detail in Sect. 4.3.
Looking at the plot of the radial velocity (VR) as a function of R (displayed in panel b of Fig. 1), shows that more than half of the clusters in our sample have radial velocities that are not consistent with zero, suggesting they are on non-circular, more elongated orbits. While for most clusters VR is less than ∼25 km s−1, there are two outliers with very negative radial velocities, NGC 1718 (VR = −70.1 km s−1) and NGC 1868 (VR = −50.8 km s−1; however, the isochrone fits were less robust for this cluster). This distribution in radial velocities is similar to what has been determined by Bennet et al. (2022), although we find an overall smaller scatter in the velocities.
The out-of-plane velocity component (VZ) and the vertical distance (Z) of the clusters as a function of R are illustrated in panels c and d of Fig. 1. Our measurements suggest that most clusters in our sample have absolute vertical velocities smaller than ∼20 km s−1. The most remarkable feature in this plot, however, is the group of intermediate-age clusters at R∼2–3 kpc with large vertical velocities, up to ∼44 km s−1 (this feature is also evident in Figure 3 of the study from Bennet et al. 2022). This could indicate that the motion of these clusters have been disturbed in the vertical direction by a past encounter with the SMC. Interestingly, these clusters seem to be located very close to the LMC disc plane (see panel d). In panel c, NGC 1978 stands out as an outlier, as it is the only cluster in our sample that has a significant negative out-of-plane velocity (VZ ∼ −25 km s−1). We discuss the impact of past LMC–SMC interactions on the motions of the clusters in detail in Sect. 5.
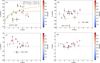 |
Fig. 1 Velocities and positions of the young and intermediate-age clusters within the LMC as a function of the radial distance from the galaxy’s centre, R. In each panel, the clusters with less robust isochrone fits are denoted with diamond symbols and grey error bars. Panel a presents the tangential velocity, Vϕ. Theoretical circular velocities resulting from a pure NFW profile (orange solid line) and a model composed of a dark matter halo and a stellar disc and bar (green dashed line) are also shown. The size of the stellar bar is indicated by the vertical dashed line. Panel b shows the radial velocity, VR; the out-of-plane velocity, VZ, is presented in panel c; and panel d shows the vertical distance from the plane, Z. In all panels, the clusters are colour-coded by the logarithm of their ages (in years). |
4.3 Orbits of young clusters
A more illustrative way to look at the dynamics of the clusters is to reconstruct and study their orbits within the galaxy. To this end, we used the observed 6D phase-space information of the clusters and modelled their orbits within the LMC. As the potential of the LMC in which we place the clusters, we assumed the two LMC models by Kacharov et al. (2024) shown in Fig. 1 (see Sect. 4.2). As in Niederhofer et al. (2025), for clusters within the inner 2 kpc of the LMC (where the bar plays a significant role in influencing the dynamics of the clusters), we used the multi-component model consisting of a spherical NFW dark matter halo and a stellar component (disc and triaxial bar). For clusters located at larger radii, we used the pure NFW mass profile, which depicts the best representation of the outer potential of the LMC (see also Watkins et al. 2024).
We only performed the orbital analysis for the young (<1 Gyr) clusters within our sample and used the measured kinematics of the intermediate-age clusters to constrain the LMC–SMC interaction history (see Sect. 5). We used the python package galpy6 (Bovy 2015) for the reconstruction of the orbits and integrated the orbits backward for the inferred lifetimes of the young clusters (see Table 1). To assess the uncertainties in the resulting orbital parameters of the clusters, we created for each of the young clusters 500 realisations of the initial conditions by randomly drawing from Gaussian distributions centred around the measurements for their positions and velocities, and with standard deviations corresponding to the measurement uncertainties. Table F.1 provides an overview of the reconstructed orbital parameters of the young clusters.
The resulting orbits of the young clusters in the frame of the LMC, along with 50 of these random realisations, are illustrated in Fig. 2. The current positions of the clusters are indicated by coloured circles while the black crosses mark the inferred birth locations of the clusters. As expected, most of the young clusters rotate within, or very close to, the disc of the LMC.
NGC 1856 (purple lines in Fig. 2) is the innermost cluster in our sample. Since it is located close to the bar, its orbit is largely affected by this central structure. The cluster follows a box-like orbit (Binney 1982) that is oriented approximately parallel to the bar. NGC 1856 seems to be confined within the inner regions of the LMC, with an apocentre distance of 1.36±0.59 kpc and a maximum vertical height above the disc of 1.16±0.74 kpc.
NGC 1805, NGC 1818, NGC 1831, and NGC 1866 (blue, orange, green, and brown lines, respectively, in Fig. 2) orbit the LMC within the plane of the disc. Of the four clusters, NGC 1818 follows an orbit that is closest aligned with the disc of the galaxy (inclination angle of 9±5◦relative to the plane of the LMC disc). The orbits of the other clusters show moderate inclination angles of 22±5◦ (NGC 1805), 15±13◦ (NGC 1831) and 19±10◦ (NGC 1866). While tracing back the orbits of the two youngest clusters in our sample, NGC 1805 (40 Myr) and NGC 1818 (60 Myr), we noted that the inferred birth places of both clusters are at larger galactocentric distances than their current positions. At present, NGC 1805 and NGC 1818 are located at R=3.53 kpc and R=2.90 kpc respectively, whereas they likely formed at R0=4.35±0.31 kpc and R0=4.85±0.55 kpc respectively. Piatti et al. (2019b) determined the metallicities of a sample of young clusters within the LMC and found that for some of them (like NGC 1711 and NGC 1847, which are not within our sample of clusters), the metallicity does not match the one of the surrounding field population. The authors concluded that these clusters might have migrated from the places they have formed. Based on our results, it seems plausible that young clusters can be scattered from their birth places and radially migrate to different galactocentric radii. Indeed, Vijayasree et al. (2025) recently studied the PM field of the LMC disc using data from the VISTA Survey of the Magellanic Cloud system (Cioni et al. 2011) and found evidence of streaming motions of stars north of the bar structure towards the centre of the LMC. This motion seems to be reflected in the orbits of NGC 1805 and NGC 1818, as well. Recently, Rathore et al. (2025) investigated the response of the LMC bar to the recent SMC pericentre passage. They suggest that the bar is currently resettling within the potential of the LMC. The observed motions in the northern parts of the LMC are consistent with the predictions of the simulations from Rathore et al. (2025) and can thus be interpreted as a direct consequence of the bar response.
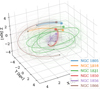 |
Fig. 2 Reconstructed orbits of the six young (<1 Gyr) clusters within the LMC. The orbits have been integrated backwards for the inferred lifetime of the clusters. The coloured circles represent their current positions within the galaxy and the black crosses indicate the birth places of the clusters. For orientation, the shown contours follow the density of the LMC field star population. The plot is oriented such that north is approximately to the top and east approximately to the left of the image. |
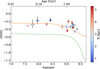 |
Fig. 3 Age-metallicity relation of the young and intermediate-age clusters studied in this work. The clusters are colour-coded according to their cylindrical galactocentric distance, R. Clusters with less robust isochrone fits are illustrated with diamond symbols and grey error bars. Also shown are analytical models of the chemical evolution of the LMC (orange solid line) and SMC (green dashed line), assuming a bursting star formation rate (Pagel & Tautvaisiene 1998). |
NGC 1850
The cluster NGC 1850 represents an interesting exception to the other young clusters, as it follows a considerably different orbit (red line in Fig. 2). NGC 1850 rotates almost perpendicular to the LMC disc, with an inclination angle of 75.33±6.16◦ relative to the disc plane. Additionally, the orbital plane is oriented such that the cluster is on a slight retrograde orbit. NGC 1850 has completed approximately half an orbit around the LMC since its birth. It has just passed apocentre, and is currently located 1.48±0.18 kpc above the disc plane. The birth location of NGC 1850 resulting from rewinding its orbit for 100 Myr lies very close to the LMC disc plane (Z0=–0.24±0.41 kpc). Further, the inferred metallicity of NGC 1850 is typical for LMC clusters at the age of 100 Myr (see Fig. 3). Thus, it seems unlikely that NGC 1850 formed out of gas that was accreted from the SMC onto the LMC.
Since the velocity and position of NGC 1850 results in a rather unexpected orbit that cannot easily be explained by the latest LMC–SMC interaction, we now assess the robustness of this result and explore how sensitive the reconstructed orbit is to the assumed parameters of the cluster. Assuming literature PM (from Milone et al. 2023a,b) and LOS velocity measurements (from Kamann et al. 2023, and the database of Structural Parameters of Local Group Star Clusters), we found that these different assumptions for the motion of NGC 1850 do not have a significant effect on its reconstructed orbit. The resulting orbits all follow very similar trajectories, with inclination angles with respect to the LMC disc between 75◦ and 85◦, eccentricities between 0.26 and 0.33, vertical distances at the time of the birth of the cluster, Z0, between –0.23 kpc and –0.31 kpc, as well as consistent apocentric distances of rapo = 1.91 kpc. We then tested the dependence on the inferred distance to the cluster. Among literature studies, there exists a broad range of distance determinations for NGC 1850, indicating a large overall uncertainty. For our tests, we adopted the following measurements for the distance modulus: 18.35 mag (Bastian et al. 2016; Milone et al. 2018), 18.38 mag (Milone et al. 2023a) and 18.45 mag (Correnti et al. 2017; Yang et al. 2018). The range of these measurements correspond to physical distances between 46.77 kpc and 48.98 kpc. Distance moduli smaller than the one inferred by us (18.40 mag) have no significant effects on the overall shape and orientation of the final orbit. Adopting a distance modulus of 18.38 mag would result in a consistent (with respect to the one resulting from our determined distance modulus) inclination angle of 78±5.75◦, but a larger maximum vertical distance from the LMC disc of 1.84±0.17 kpc, and a larger apocentric distance of 2.29±0.15 kpc. A value of 18.35 mag would put NGC 1850 on an even more extreme orbit with a maximum vertical distance from the disc plane of 2.39±0.20 kpc and an apocentric distance of 2.89±0.17 kpc. However, adopting 18.45 mag for the distance modulus changes significantly the resulting orbit. This distance would place NGC 1850 closer to the disc plane (Z=0.55 kpc), and put it on a radial orbit along the bar structure (similar to the orbit of NGC 1856), oscillating through the disc plane. These tests suggest that the shape of the orbit of NGC 1850 is very sensitive to the assumed distance from the LMC disc plane and small uncertainties lead to relatively large differences in the final orbit. Although our isochrone fitting method provides homogeneous and precise distances for the clusters, the adopted distance and orientation for the LMC disc have not been estimated with the same methodology. Thus, the relative distance between the LMC and NGC 1850 might suffer for additional systematics. Moreover, young clusters have less populated and irregular upper CMDs, making their distance estimates possibly more uncertain. We note that also the shape of the orbit of NGC 1856 depends on the assumed distance. If adopting a distance modulus of 18.32 mag, as determined by Milone et al. (2023a), which would place the cluster about 3.6 kpc above the disc, would result in a wide orbit that is highly inclined with respect to the LMC disc.
For an alternative scenario, we followed the simplistic assumption that all young clusters are located right in the disc plane at their respective positions, a likely scenario for young clusters. We reconstructed again the orbits for this configuration and inspected them. The orbits for all young clusters, except for NGC 1850, are very similar to their original orbits, but now moving very close to the disc plane. We note that the shapes of the orbits were not affected significantly. Thus, our above discussion would still be valid in this scenario. The most significant change in the orbits is only for NGC 1850, which is now on an extreme radial orbit moving along the LMC bar (see Fig. G.1).
In summary, we found the orbit of NGC 1850 is very sensitive to the assumed distance to the LMC disc. If we take our inferred value of the distance modulus for NGC 1850 and the literature values for the distance and orientation of the LMC disc as face value, our results suggest a peculiar orbit for the cluster, orbiting the galaxy with a large inclination angle. Alternatively, if we assume that all young clusters reside in the disc (resulting in a distance modulus for NGC 1850 of 18.48 mag), then NGC 1850 follows the LMC bar on a highly eccentric orbit.
4.4 Searching for accreted clusters in the LMC
In this section, we use the collection of kinematic data, combined with the inferred ages and metallicities of our sample of clusters, to search for any evidence of clusters that might have been stripped from the SMC and accreted by the LMC during the last close encounter of the two galaxies. Olsen et al. (2011) studied the LOS dynamics of the LMC disc using a sample of 6000 giant stars, and identified a population of about 5% of the stars as outliers that are apparently on retrograde orbits with respect to the direction of the bulk rotation of the LMC disc. This kinematic signature can be interpreted as actual counter-rotating stars, or stars that reside within a rotating disc that is inclined compared to the main LMC disc plane. Regardless of interpretation, as these stars also show lower metallicities than the average LMC disc population, Olsen et al. (2011) concluded that these outliers have been accreted from the SMC onto the LMC.
Based on LOS velocity measurements, the intermediate-age clusters NGC 1806 and NGC 1846 would belong to the outlier population of apparently counter-rotating stars. However, thanks to the full 6D phase space information collected in this study, we are able to assess their 3D kinematics within the LMC and establish the nature of these objects. We found that both clusters have positive tangential velocities, meaning that they follow the main rotation pattern of the LMC and are not on retrograde orbits (see Table B.2 and Fig. 1). However, we note that the rotational velocity of the two clusters, Vϕ = 28.6±7.1 km s−1 (NGC 1806) and Vϕ = 17.0±10.8 km s−1 (NGC 1846), is much smaller than predicted by the theoretical circular velocity curves at the location of the clusters. Both NGC 1806 and NGC 1846 have moderate velocities in the radial direction (VR = −16.3±8.6 km s−1 for NGC 1846 and VR = −20.8±8.6 km s−1 for NGC 1846) and are located close to the disc of the LMC. However, the two clusters show considerable vertical out-of-plane velocities (VZ = −43.9±4.8 km s−1 for NGC 1846 and VZ = −28.1±6.9 km s−1 for NGC 1846). These kinematic signatures of NGC 1806 and NGC 1846 do not provide any clear evidence of the clusters being accreted from the SMC. Rather, the orbits of the two clusters might have been disturbed in the past by the encounters with the SMC (see Sect. 5). Further, based on the kinematics, the other clusters in our sample do not show any peculiarities that can be seen as clear signs of an ex-situ origin.
Since the SMC is on average more metal-poor than the LMC (e.g. Choudhury et al. 2020, 2021; Grady et al. 2021; Omkumar et al. 2025, and references therein), star clusters that originate from the smaller galaxy can also reveal themselves based on their chemical composition. By comparing predicted age-metallicity relations of massive star clusters from the E-MOSAICS simulation with observed properties of LMC and SMC star clusters, Horta et al. (2021) showed that clusters follow the properties of their host galaxies. Thus, star clusters formed within galaxies of different masses and star-formation histories follow distinct age-metallicity relations. Thus, we focus on the ages and metallicities of the clusters that we derived in Sect. 3. In Fig. 3, we present the positions of the 19 studied clusters in the age-metallicity space. Also shown as an orange solid line is an analytical model of the chemical evolution of the LMC, assuming a bursting star formation rate (Pagel & Tautvaisiene 1998). It is immediately evident that the overall observed age-metallicity relation of the clusters closely follows the analytical model of the LMC. The intermediate-age clusters reproduce well the increase in metallicity at ∼2 Gyr (log(age)∼9.3). This increase is likely caused by a burst in the star formation rate at these times, as recovered by Mazzi et al. (2021). Further, Fig. 3 also displays the model from Pagel & Tautvaisiene (1998) of the SMC as a green dashed line. This relation follows an enrichment history distinct from the one of the LMC, with a period of rapid enrichment about 2–3 Gyr ago and an overall lower metallicity than the LMC. As can be seen from the figure, all of the clusters studied in this work are located significantly above the SMC sequence, suggesting they are all genuine LMC member clusters. Analysis of Strömgren photometry of 110 LMC star clusters by Narloch et al. (2022) confirms that the bursty star formation of Pagel & Tautvaisiene (1998) is appropriate for LMC clusters, and that clusters from the LMC and SMC follow distinct chemical enrichment histories. Taken everything together, we found no clear-cut evidence that a cluster within our sample has has been accreted from the SMC during a previous interaction event.
5 Comparison with dynamical models
5.1 Model set-up
In the final section of this study, we attempt to interpret the derived kinematic and structural properties of the sample of intermediate-age clusters within the LMC in terms of the interaction history of the LMC with the SMC. To do so, we compare our results to a suite of simple dynamical simulations that model the combined effects of the SMC and the Milky Way on the LMC for a set of different orbital histories. These models were initially developed to interpret the kinematic substructures in the outskirts of the LMC and were presented in detail by Cullinane et al. (2022a,b). We provide here a brief description of the basic model parameters and also discuss important limitations and caveats of the simulations. The LMC is modelled as a system of test particles orbiting a particle sourcing a rigid potential that consists of two components: a dark matter halo that follows a Hernquist (1990) profile with a total mass of 1.5 × 10¹¹ M⊙ and a scale radius of 20 kpc, as well as an exponential stellar disc with a mass of 2 × 10⁹ M⊙, a scale radius of 1.5 kpc, and a scale height of 0.4 kpc. The SMC was modelled as a particle sourcing a pure Hernquist dark matter halo with a mass of 2.5 × 10⁹ M⊙ and a scale radius of 0.043 kpc, with no test particles placed within the potential. The model for the Milky Way potential was set up similar to the MWPotential2014 (Bovy 2015) and consists of three components; namely a stellar disc, bulge, and dark matter halo. All three galaxies in the simulation were treated as particles sourcing the associated potentials, which allowed us to account for the reflex motion of the Milky Way in response to the LMC. Note that the model accounts for the effects of dynamical friction between the motions of the LMC and the Milky Way, but not between the LMC and the SMC.
The simulations start by initialising the LMC and the SMC with their present-day positions and velocities. Then, their orbits were rewound back for 1 Gyr in the presence of each other and the Milky Way. The disc of the LMC was aligned such that its orientation matches the values as derived by Choi et al. (2018), and that orientation was held fixed during the simulation due to the rigid nature of the assumed potential. This sets the initial conditions for the models. The LMC disc was then initialised with ∼ 2.5 × 10⁶ tracer particles using the AGAMA software package (Vasiliev 2019) to account for the velocity dispersion of the LMC disc and the thickness of the disc. Finally, the system is evolved forward to the present time.
For the present study, we used the ‘base-case’ suite of models. For this set of models, 100 individual realisations of the initial conditions were run, sampling from literature values and their associated uncertainties for the present-day distances and velocities of the LMC and SMC (see Table H.1). These realisations result in a variety of different possible orbital histories and interaction events for the Clouds. It is worth noting that these different runs all resulted in consistent orbits of the Clouds around our Galaxy, with the two galaxies just past their first percentric passage around the Milky Way. However, the orbit of the SMC around the LMC can vary significantly between the realisations, especially for times later than 250 Myr ago. In all models, the SMC had a recent close pericentre passage around the LMC about 150 Myr ago. This is in agreement with the results from other studies (e.g. Zivick et al. 2018; Choi et al. 2022) that predict a close encounter of the SMC with the LMC about 150 Myr ago. These passages occurred significantly below the disc of the LMC, with Zperi = −6.8 ± 2.6 kpc. About half of the realisations show an SMC disc crossing about 400 Myr ago at a broad range of in-disc distances (∼20–40 kpc). Additionally, another 10% of the models show another disc-crossing event at ∼900 Myr ago, although this crossing would occur within a larger number of realisations if the models were rewound beyond 1 Gyr.
5.2 Caveats
This suite of models allows a large variety of possible orbital histories of the Clouds to be explored. However, due to the simplicity of the simulations, the models have some important limitations. In particular, the use of rigid potentials can have significant effects on the evolution of the system. For one, the dark matter halos of the galaxies do not deform as a response to the gravitational interactions, potentially affecting the orbits of the galaxies. Additionally, the test particles in the LMC are not able to directly affect each other (i.e. there is no self-gravity), and thus the potential of the disc also does not change in shape and orientation. This will limit the effect of perturbations induced in the LMC disc as responses to interactions.
As discussed by Cullinane et al. (2022a), these limitations will have the most significant effects for close collisions between the Clouds, where the SMC crosses the LMC disc plane at small galactocentric radii. Such interactions can introduce additional asymmetries in the disc, such as offsets between the dynamical centre of the disc and the bar or density waves and spiral arms in the disc. These simple models are not able to fully reproduce such effects.
Finally, it is important to note that the models were originally designed to study dynamic features within the outer regions of the LMC. To save computation time, the models therefore only include test particles with apocentres greater than 7 kpc. This means that the density of particles within the inner regions, where most of our studied clusters are at present, is significantly reduced. Thus, the models might not be able to fully capture features induced by the different interaction events within the central parts of the LMC and the results should not be over-interpreted. Nevertheless, the models provide valuable explorations of the possible effects the various LMC–SMC interactions can have on the dynamical and structural properties of the clusters within the LMC. Given these limitations associated with the simple models, here we provide only qualitative comparisons with our observations.
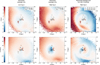 |
Fig. 4 Predictions for three individual model realisations with different LMC–SMC orbital histories. The upper row shows the vertical out-of-plane distance (Z) for each model, while the lower row presents the vertical out-of-plane velocity (VZ). The columns, from left to right, show the following model realisations for which the LMC experiences different interaction events with the SMC: only an SMC pericentre passage about 150 Myr ago with an impact parameter Zperi = −6.6 kpc; only an SMC pericentre passage, but now more recently, about 110 Myr ago with a smaller impact parameter of only Zperi = −2 kpc; two events of the SMC crossing the disc plane of the LMC at ∼340 Myr and ∼910 Myr ago, in addition to the SMC pericentre passage of the LMC ∼150 Myr ago. In the upper-right panel, the locations of the disc crossings are indicated with a blue and orange cross. The intermediate-age clusters in our sample are indicated by coloured circles, where the colour represents the measured out-of-plane distance Z (upper panels), and the out-of-plane velocity VZ (lower panels), respectively. Clusters with less robust isochrone fits are illustrated with diamond symbols. The black contours shown in all panels follow the stellar density of the LMC bar structure. |
5.3 Comparison with observations
The models provide, for each realisation, the following mock observables of each test particle at the present time: the RA and Dec position on the sky, the distance and velocity along the LOS, as well as the PMs in RA and Dec direction. We used the formalism described in Sect. 4.1 to transform these model observations into the reference frame of the LMC for a direct comparison with the properties of the clusters. Since the models assume for the geometry and orientation of the LMC disc the values as determined by Choi et al. (2018), we also use these parameters to de-project the positions and velocities of the model particles.
For the comparison of the models with our observations, we concentrated on two quantities: the vertical distance from the LMC disc plane, Z, and the vertical out-of-plane velocity, VZ. Due to the absence of tracer particles with apocentres of less than 7 kpc, we refrained from using the tangential velocity, Vϕ, and radial velocity, VR, for our comparisons since these quantities would not provide useful constraints. To select the simulations that best reproduce our observations from the 100 realisations, we followed a similar approach to the one used by Navarrete et al. (2023), employing a log-likelihood (log ℒ) method. For each cluster, we selected the 75 spatially closest tracer particles (as a compromise between statistics and spatial resolution) in a given realisation and determined their median Z and VZ values. We then calculated the combined log ℒ for measuring these observables for all clusters given the present model. We performed this step for all 100 realisations.
To illustrate the qualitative effects of the different interaction histories on the LMC and their relations to the measured properties of our sample of star clusters, we show in Fig. 4 spatially binned maps for three different model realisations. For each of these realisations we show the median vertical out-of-plane distance Z (upper panels) and median out-of-plane velocity VZ (lower panels). Also shown as coloured circles are the positions of the studied clusters, colour-coded according to the corresponding quantities, using the same scale as for the maps. The left-hand column of Fig. 4 shows one of the model instances with a low log ℒ, i.e. it poorly resembles the observations. In this realisation, the LMC only experiences the most recent SMC pericentric passage that occurred about 150 Myr ago, with the closest approach at Zperi = −6.6 kpc below the plane of the LMC.
While this realisation is able to qualitatively reproduce the overall observed vertical velocity structure of the clusters (although we measure larger velocities than predicted by the models), there are discrepancies in the distances perpendicular to the disc plane. The clusters located closest to the centre have vertical displacements close to zero, as suggested by the models. However, the group of clusters located at X∼–3 kpc and Y∼–3 kpc are displaced consistently above the disc, while the model predicts a perturbation towards negative Z values.
The middle and right-hand panels in Fig. 4 show the two model instances with the largest log ℒ values, i.e. they best resemble the observed cluster properties. Similar to the model in the left-hand panels, the realisation shown in the middle panels only experiences the most recent encounter with the SMC. In this case, however, the passage of the SMC happened more recently – at about 110 Myr ago, at a much closer distance below the disc (Zperi of only −2.0 kpc). This close interaction had more severe effects on the kinematics of the disc, as is evident from the maps. There is a reasonably overall good agreement between this model instance and the observations. The simulation is able to reproduce the displacement towards positive Z values of the clusters south-east of the LMC centre. Similarly, the predicted vertical velocity structure broadly follows the observations, with the clusters to the south-east having VZ close to zero and the clusters towards the west of the LMC centre moving with positive vertical velocities. This model is also able to reproduces the observed negative VZ of NGC 1978 (located at X∼–1 kpc and Y∼3 kpc). Based on these qualitative comparisons, the observed properties of the clusters would support a scenario of a recent close LMC–SMC interaction. However, this possibility is not supported by other studies. Specifically, Choi et al. (2022) studied the kinematic pattern of the LMC disc based on Gaia DR3 PMs and compared it to numerical simulations, with the level of disc heating they measured largely excluding an interaction of the two galaxies with small impact parameters ∼110 Myr ago.
The two panels on the right-hand side in Fig. 4 show a realisation in which the LMC experiences two disc crossings of the SMC, about 340 and 910 Myr ago, besides the recent SMC peri-centre passage ∼150 Myr ago. The predicted locations where the SMC crossed the disc are indicated in the upper-right panel as blue and orange crosses, respectively. The orbital history of this model also reproduces reasonably well the observations. In terms of the vertical distance from the disc plane, the clusters near the centre are very close to the plane, and the displacement towards positive Z-values for the group of four clusters towards the southeast is reproduced by the models. Only the two clusters at the west end of the bar structure (NGC 1651 and NGC 1751), located above the disc, are not predicted by the model. The overall vertical velocity structure of the clusters is also in good agreement with the predictions from the model. The vertical velocities of the four clusters in the south-east are almost zero, while the clusters towards the west of the centre move with positive in-plane velocities. This model realisation, as the previous one, predicts a negative vertical velocity feature near the centre of the galaxy, which would be in agreement with the motion of NGC 1978 (X∼–1 kpc and Y∼3 kpc); however, the cluster seems to be somewhat displaced with respect to this feature. In contrast, NGC 2108 (located at X,Y∼–2 kpc,∼0 kpc) for which the model suggests a negative velocity shows a positive vertical motion. It is worth noting here that the kinematics of NGC 2108 and the two clusters at the west end of the bar could potentially be impacted by the bar, especially in a scenario where the bar was rotating in the past (Jiménez-Arranz & Roca-Fàbrega 2025). This influence by the bar is not captured in the models. We verified that these clusters did not impact our selection of the best-fitting models by performing the log ℒ again excluding these clusters.
Overall, our qualitative comparisons with this suite of simple models favours a scenario in which the LMC experiences two disc crossings of the SMC within the last Gyr, besides the most recent pericentric passage of the SMC about 150 Myr ago (the model with a recent close SMC pericentre passage is excluded by the measured level of disc heating in the LMC). This result is in agreement with the findings by Cullinane et al. (2022b) and Navarrete et al. (2023). These two studies analysed the kinematics of different substructures within the outskirts of the LMC and used the same set of simple simulations to interpret their results. Both studies found that the observed kinematic structures in the outer regions of the LMC can be explained by at least one additional disc crossing of the SMC. Navarrete et al. (2023) additionally expanded the models to cover the age range up to 2 Gyr ago and found the best agreement between models and observations for a scenario with three disc crossings where the last one happened at 1.9 Gyr ago. Although the results obtained for our sample of clusters and the findings for the outer LMC regions lead to the same conclusions, we emphasise again that due to the simplistic nature of the used models, the simulations are not able to fully capture all effects induced by the interactions of the galaxies. Thus, more detailed models, especially for the inner regions, would be required to definitively constrain the complex interaction history of the Clouds.
6 Summary and conclusions
In this work, we have studied the kinematic structure of a sample of 19 young and intermediate-age LMC star clusters. We derived homogeneous estimates for their ages, distances, and metallicities, and we determined their full 3D motions resulting from multi-epoch HST PMs and LOS velocities from the literature. This allowed us to reconstruct the positions and velocity components of the clusters in the frame of the LMC.
As expected, young clusters (<1 Gyr) orbit close to the disc plane of the galaxy. A remarkable exception is NGC 1850. Our derived distance to the cluster would put it on a highly inclined, slightly retrograde orbit. Additional tests, however, suggest that the resulting orbit is very sensitive to the exact distance of the cluster to the LMC disc plane. When assuming a distance that would put the cluster within the disc plane, NGC 1850 follows a highly eccentric orbit along the LMC bar structure. The orbits of young clusters that formed north of the LMC centre show high tangential velocities and elongated orbits, suggesting they formed at larger galactocentric distances. These features could be a consequence of the resettling motion of the LMC bar. From the combined information coming from the orbital properties of the clusters and their location in the age-metallicity space, we find no evidence in our sample of clusters that might have been accreted onto the LMC from the SMC during one of their last encounters or that have been formed out of stripped low-metallicity material from the SMC.
In the last part of the paper, we compared the inferred positions and velocities of the intermediate-age clusters with a suite of simple dynamical models in order to interpret our results. A scenario in which the SMC crossed the LMC disc plane twice (about 300 and 900 Myr ago) in combination with a recent SMC pericentre passage (about 150 Myr ago) can qualitatively explain the observed kinematic structure of the clusters. This is in accordance with the results for the kinematics of substructures in the outer parts of the LMC. Self-gravitating models that also focus on the inner regions of the LMC, along with a larger sample of clusters with measured velocities and distances, will be required to definitively confirm this scenario.
Acknowledgements
We thank the anonymous referee for constructive comments and suggestions that improved the quality of our paper. This research was funded by DLR grant 50 OR 2216. DM and SC acknowledge financial support from PRIN-MIUR-22: CHRONOS: adjusting the clock(s) to unveil the CHRONO-chemo-dynamical Structure of the Galaxy” (PI: S. Cassisi). SS acknowledges funding from the European Union under the grant ERC-2022-AdG, “StarDance: the non-canonical evolution of stars in clusters”, Grant Agreement 101093572, PI: E. Pancino. Support for this work was provided by NASA through grants for program GO-16478 from the Space Telescope Science Institute (STScI), which is operated by the Association of Universities for Research in Astronomy (AURA), Inc., under NASA contract NAS5-26555. This work is based on observations made with the NASA/ESA Hubble Space Telescope, obtained from the Data Archive at the Space Telescope Science Institute. This work has made use of data from the European Space Agency (ESA) mission Gaia (https://www.cosmos.esa.int/gaia), processed by the Gaia Data Processing and Analysis Consortium (DPAC, https://www.cosmos.esa.int/web/gaia/dpac/consortium). Funding for the DPAC has been provided by national institutions, in particular the institutions participating in the Gaia Multilateral Agreement. This research made use of astropy (http://www.astropy.org), a community-developed core python package for Astronomy (Astropy Collaboration 2022), iphython (Perez & Granger 2007), Jupyter Notebook (Kluyver et al. 2016), matplotlib (Hunter 2007), numpy (Harris et al. 2020) and scipy (Virtanen et al. 2020).
References
- Aguado-Agelet, F., Massari, D., Monelli, M., et al. 2025, A&A, 704, A255 [NASA ADS] [CrossRef] [EDP Sciences] [Google Scholar]
- Anderson, J. 2022, One-Pass HST Photometry with hst1pass, Instrument Science Report WFC3 2022-5, 55 [Google Scholar]
- Anderson, J., & Bedin, L. R. 2010, PASP, 122, 1035 [CrossRef] [Google Scholar]
- Asa’d, R., Hernandez, S., As’ad, A., et al. 2022, ApJ, 929, 174 [CrossRef] [Google Scholar]
- Astropy Collaboration (Price-Whelan, A. M., et al.) 2022, ApJ, 935, 167 [NASA ADS] [CrossRef] [Google Scholar]
- Bastian, N., Niederhofer, F., Kozhurina-Platais, V., et al. 2016, MNRAS, 460, L20 [NASA ADS] [CrossRef] [Google Scholar]
- Bellini, A., & Bedin, L. R. 2009, PASP, 121, 1419 [CrossRef] [Google Scholar]
- Bellini, A., Anderson, J., & Bedin, L. R. 2011, PASP, 123, 622 [CrossRef] [Google Scholar]
- Bellini, A., Anderson, J., van der Marel, R. P., et al. 2014, ApJ, 797, 115 [Google Scholar]
- Bellini, A., Bianchini, P., Varri, A. L., et al. 2017, ApJ, 844, 167 [NASA ADS] [CrossRef] [Google Scholar]
- Bellini, A., Libralato, M., Bedin, L. R., et al. 2018, ApJ, 853, 86 [NASA ADS] [CrossRef] [Google Scholar]
- Bennet, P., Alfaro-Cuello, M., Pino, A. d., et al. 2022, ApJ, 935, 149 [Google Scholar]
- Binney, J. 1982, MNRAS, 201, 1 [Google Scholar]
- Boubert, D., Erkal, D., Evans, N. W., & Izzard, R. G. 2017, MNRAS, 469, 2151 [NASA ADS] [CrossRef] [Google Scholar]
- Bovy, J. 2015, ApJS, 216, 29 [NASA ADS] [CrossRef] [Google Scholar]
- Cardelli, J. A., Clayton, G. C., & Mathis, J. S. 1989, ApJ, 345, 245 [Google Scholar]
- Cassisi, S., Salaris, M., Castelli, F., & Pietrinferni, A. 2004, ApJ, 616, 498 [NASA ADS] [CrossRef] [Google Scholar]
- Ceccarelli, E., Massari, D., Aguado-Agelet, F., et al. 2025, A&A, 704, A256 [NASA ADS] [CrossRef] [EDP Sciences] [Google Scholar]
- Choi, Y., Nidever, D. L., Olsen, K., et al. 2018, ApJ, 866, 90 [Google Scholar]
- Choi, Y., Olsen, K. A. G., Besla, G., et al. 2022, ApJ, 927, 153 [NASA ADS] [CrossRef] [Google Scholar]
- Choudhury, S., de Grijs, R., Rubele, S., et al. 2020, MNRAS, 497, 3746 [NASA ADS] [CrossRef] [Google Scholar]
- Choudhury, S., de Grijs, R., Bekki, K., et al. 2021, MNRAS, 507, 4752 [CrossRef] [Google Scholar]
- Cioni, M. R. L., Clementini, G., Girardi, L., et al. 2011, A&A, 527, A116 [CrossRef] [EDP Sciences] [Google Scholar]
- Correnti, M., Goudfrooij, P., Bellini, A., Kalirai, J. S., & Puzia, T. H. 2017, MNRAS, 467, 3628 [NASA ADS] [Google Scholar]
- Cullinane, L. R., Mackey, A. D., Da Costa, G. S., et al. 2022a, MNRAS, 510, 445 [Google Scholar]
- Cullinane, L. R., Mackey, A. D., Da Costa, G. S., et al. 2022b, MNRAS, 512, 4798 [NASA ADS] [CrossRef] [Google Scholar]
- Erkal, D., Belokurov, V., Laporte, C. F. P., et al. 2019, MNRAS, 487, 2685 [Google Scholar]
- Fehrenbach, C., & Duflot, M. 1974, A&AS, 13, 173 [Google Scholar]
- Forbes, D. A., Bastian, N., Gieles, M., et al. 2018, Proc. Roy. Soc. Lond. Ser. A, 474, 20170616 [NASA ADS] [Google Scholar]
- Freeman, K. C., Illingworth, G., & Oemler, A. J., 1983, ApJ, 272, 488 [Google Scholar]
- Freedman, W. L., Madore, B. F., Gibson, B. K., et al. 2001, ApJ, 553, 47 [Google Scholar]
- Gaia Collaboration (Helmi, A., et al.) 2018, A&A, 616, A12 [NASA ADS] [CrossRef] [EDP Sciences] [Google Scholar]
- Gaia Collaboration (Vallenari, A., et al.) 2023, A&A, 674, A1 [NASA ADS] [CrossRef] [EDP Sciences] [Google Scholar]
- Graczyk, D., Pietrzyński, G., Thompson, I. B., et al. 2014, ApJ, 780, 59 [Google Scholar]
- Graczyk, D., Pietrzyński, G., Thompson, I. B., et al. 2020, ApJ, 904, 13 [Google Scholar]
- Grady, J., Belokurov, V., & Evans, N. W. 2021, ApJ, 909, 150 [Google Scholar]
- Grocholski, A. J., Cole, A. A., Sarajedini, A., Geisler, D., & Smith, V. V. 2006, AJ, 132, 1630 [NASA ADS] [CrossRef] [Google Scholar]
- Harris, J., & Zaritsky, D. 2006, AJ, 131, 2514 [Google Scholar]
- Harris, C. R., Millman, K. J., van der Walt, S. J., et al. 2020, Nature, 585, 357 [NASA ADS] [CrossRef] [Google Scholar]
- Hernquist, L. 1990, ApJ, 356, 359 [Google Scholar]
- Hidalgo, S. L., Pietrinferni, A., Cassisi, S., et al. 2018, ApJ, 856, 125 [Google Scholar]
- Horta, D., Hughes, M. E., Pfeffer, J. L., et al. 2021, MNRAS, 500, 4768 [Google Scholar]
- Hunter, J. D. 2007, Comput. Sci. Eng., 9, 90 [NASA ADS] [CrossRef] [Google Scholar]
- Jiménez-Arranz, Ó., & Roca-Fàbrega, S. 2025, A&A, 698, L7 [NASA ADS] [CrossRef] [EDP Sciences] [Google Scholar]
- Jiménez-Arranz, Ó., Romero-Gómez, M., Luri, X., et al. 2023, A&A, 669, A91 [NASA ADS] [CrossRef] [EDP Sciences] [Google Scholar]
- Kacharov, N., Tahmasebzadeh, B., Cioni, M.-R. L., et al. 2024, A&A, 692, A40 [NASA ADS] [CrossRef] [EDP Sciences] [Google Scholar]
- Kallivayalil, N., van der Marel, R. P., Besla, G., Anderson, J., & Alcock, C. 2013, ApJ, 764, 161 [Google Scholar]
- Kamann, S., Saracino, S., Bastian, N., et al. 2023, MNRAS, 518, 1505 [Google Scholar]
- Kluyver, T., Ragan-Kelley, B., Pérez, F., et al. 2016, in Positioning and Power in Academic Publishing: Players, Agents and Agendas, ed. F. Loizides & B. Schmidt, IOS Press, 87–90 [Google Scholar]
- Libralato, M., Bellini, A., Bedin, L. R., et al. 2018, ApJ, 854, 45 [NASA ADS] [CrossRef] [Google Scholar]
- Libralato, M., Bellini, A., Vesperini, E., et al. 2022, ApJ, 934, 150 [NASA ADS] [CrossRef] [Google Scholar]
- Marino, A. F., Przybilla, N., Milone, A. P., et al. 2018, AJ, 156, 116 [NASA ADS] [CrossRef] [Google Scholar]
- Massana, P., Ruiz-Lara, T., Noël, N. E. D., et al. 2022, MNRAS, 513, L40 [CrossRef] [Google Scholar]
- Massari, D., Raso, S., Libralato, M., & Bellini, A. 2021, MNRAS, 500, 2012 [Google Scholar]
- Massari, D., Aguado-Agelet, F., Monelli, M., et al. 2023, A&A, 680, A20 [NASA ADS] [CrossRef] [EDP Sciences] [Google Scholar]
- Mazzi, A., Girardi, L., Zaggia, S., et al. 2021, MNRAS, 508, 245 [NASA ADS] [CrossRef] [Google Scholar]
- Milone, A. P., Marino, A. F., Di Criscienzo, M., et al. 2018, MNRAS, 477, 2640 [Google Scholar]
- Milone, A. P., Cordoni, G., Marino, A. F., et al. 2023a, A&A, 672, A161 [NASA ADS] [CrossRef] [EDP Sciences] [Google Scholar]
- Milone, A. P., Cordoni, G., Marino, A. F., et al. 2023b, MNRAS, 524, 6149 [NASA ADS] [CrossRef] [Google Scholar]
- Mucciarelli, A., Origlia, L., Ferraro, F. R., Maraston, C., & Testa, V. 2006, ApJ, 646, 939 [NASA ADS] [CrossRef] [Google Scholar]
- Mucciarelli, A., Carretta, E., Origlia, L., & Ferraro, F. R. 2008, AJ, 136, 375 [NASA ADS] [CrossRef] [Google Scholar]
- Mucciarelli, A., Cristallo, S., Brocato, E., et al. 2011, MNRAS, 413, 837 [NASA ADS] [CrossRef] [Google Scholar]
- Mucciarelli, A., Dalessandro, E., Ferraro, F. R., Origlia, L., & Lanzoni, B. 2014, ApJ, 793, L6 [Google Scholar]
- Mucciarelli, A., Massari, D., Minelli, A., et al. 2021, Nat. Astron., 5, 1247 [NASA ADS] [CrossRef] [Google Scholar]
- Narloch, W., Pietrzyński, G., Gieren, W., et al. 2022, A&A, 666, A80 [NASA ADS] [CrossRef] [EDP Sciences] [Google Scholar]
- Navarrete, C., Aguado, D. S., Belokurov, V., et al. 2023, MNRAS, 523, 4720 [Google Scholar]
- Navarro, J. F., Frenk, C. S., & White, S. D. M. 1997, ApJ, 490, 493 [Google Scholar]
- Niederhofer, F., Cioni, M.-R. L., Schmidt, T., et al. 2022, MNRAS, 512, 5423 [NASA ADS] [CrossRef] [Google Scholar]
- Niederhofer, F., Bellini, A., Kozhurina-Platais, V., et al. 2024, A&A, 689, A162 [NASA ADS] [CrossRef] [EDP Sciences] [Google Scholar]
- Niederhofer, F., Massari, D., Aguado-Agelet, F., et al. 2025, A&A, 704, A257 [NASA ADS] [CrossRef] [EDP Sciences] [Google Scholar]
- Olsen, K. A. G., Zaritsky, D., Blum, R. D., Boyer, M. L., & Gordon, K. D. 2011, ApJ, 737, 29 [CrossRef] [Google Scholar]
- Omkumar, A. O., Cioni, M.-R. L., Subramanian, S., et al. 2025, A&A, 700, A74 [NASA ADS] [CrossRef] [EDP Sciences] [Google Scholar]
- Pagel, B. E. J., & Tautvaisiene, G. 1998, MNRAS, 299, 535 [Google Scholar]
- Perez, F., & Granger, B. E. 2007, Comput. Sci. Eng., 9, 21 [Google Scholar]
- Piatti, A. E., Alfaro, E. J., & Cantat-Gaudin, T. 2019a, MNRAS, 484, L19 [Google Scholar]
- Piatti, A. E., Pietrzyński, G., Narloch, W., Górski, M., & Graczyk, D. 2019b, MNRAS, 483, 4766 [NASA ADS] [CrossRef] [Google Scholar]
- Pietrinferni, A., Hidalgo, S., Cassisi, S., et al. 2021, ApJ, 908, 102 [NASA ADS] [CrossRef] [Google Scholar]
- Pietrzyński, G., Graczyk, D., Gallenne, A., et al. 2019, Nature, 567, 200 [Google Scholar]
- Rathore, H., Besla, G., Daniel, K. J., & Beraldo e Silva, L. 2025, ApJ, 988, 79 [Google Scholar]
- Sabbi, E., Lennon, D. J., Anderson, J., et al. 2016, ApJS, 222, 11 [NASA ADS] [CrossRef] [Google Scholar]
- Sakari, C. M., McWilliam, A., & Wallerstein, G. 2017, MNRAS, 467, 1112 [Google Scholar]
- Salaris, M., Chieffi, A., & Straniero, O. 1993, ApJ, 414, 580 [NASA ADS] [CrossRef] [Google Scholar]
- Sharma, S., Borissova, J., Kurtev, R., Ivanov, V. D., & Geisler, D. 2010, AJ, 139, 878 [NASA ADS] [CrossRef] [Google Scholar]
- Shipp, N., Erkal, D., Drlica-Wagner, A., et al. 2021, ApJ, 923, 149 [NASA ADS] [CrossRef] [Google Scholar]
- Song, Y.-Y., Mateo, M., Bailey, J. I., et al. 2021, MNRAS, 504, 4160 [NASA ADS] [CrossRef] [Google Scholar]
- Subramanian, S., & Subramaniam, A. 2012, ApJ, 744, 128 [NASA ADS] [CrossRef] [Google Scholar]
- Usher, C., Beckwith, T., Bellstedt, S., et al. 2019, MNRAS, 482, 1275 [Google Scholar]
- van der Marel, R. P., & Cioni, M.-R. L. 2001, AJ, 122, 1807 [Google Scholar]
- van der Marel, R. P., & Kallivayalil, N. 2014, ApJ, 781, 121 [Google Scholar]
- van der Marel, R. P., Alves, D. R., Hardy, E., & Suntzeff, N. B. 2002, AJ, 124, 2639 [NASA ADS] [CrossRef] [Google Scholar]
- Vasiliev, E. 2019, MNRAS, 482, 1525 [Google Scholar]
- Vasiliev, E., Belokurov, V., & Erkal, D. 2021, MNRAS, 501, 2279 [NASA ADS] [CrossRef] [Google Scholar]
- Vijayasree, S., Niederhofer, F., Cioni, M.-R. L., et al. 2025, A&A, 700, A279 [NASA ADS] [CrossRef] [EDP Sciences] [Google Scholar]
- Virtanen, P., Gommers, R., Oliphant, T. E., et al. 2020, Nat. Methods, 17, 261 [Google Scholar]
- Watkins, L. L., van der Marel, R. P., & Bennet, P. 2024, ApJ, 963, 84 [NASA ADS] [CrossRef] [Google Scholar]
- Yang, Y., Li, C., Deng, L., de Grijs, R., & Milone, A. P. 2018, ApJ, 859, 98 [Google Scholar]
- Zivick, P., Kallivayalil, N., van der Marel, R. P., et al. 2018, ApJ, 864, 55 [Google Scholar]
All cluster ages derived within the CARMA project are listed and continuously updated here: https://www.oas.inaf.it/en/research/m2-en/carma-en/
The catalogues are publicly available as a High Level Science Product at MAST under: https://archive.stsci.edu/hlsp/hamsters
A detailed list of all observations is presented in the appendix of Niederhofer et al. (2024) and in the Mikulski Archive for Space Telescopes (MAST) under the following DOI: 10.17909/7d5e-s940
There is an old estimate for the LOS velocity of NGC 1805 from Fehrenbach & Duflot (1974) who measured 390.0±10 km s−1. This value, however, would result in a velocity of NGC 1805 close to the local escape velocity of the LMC (as determined by Boubert et al. 2017).
Structural Parameters of Local Group Star Clusters
Appendix A List of observations
Tables A.1 and A.2 list the observations used for creating the astro-photometric catalogues of NGC 1751 and NGC 1818, respectively. The tables give the programme ID number, the PI, the epoch of observations, the used instrument, camera and filter combination, as well as the number of exposures along with the respective exposure times.
Appendix B Positions and velocities of the clusters
Table B.1 lists the observed positions and velocities for each cluster in our sample. The columns report the centre coordinates (RA0 and Dec0), the PMs in RA and Dec direction (µαcos(δ), µδ), as well as the LOS velocity. Table B.2 presents the transformed positions and velocities of the young and intermediate-age clusters within the reference frame of the LMC. The columns report the radial distance from the centre of the LMC (R), the position angle within the LMC disc (ϕ), the vertical distance from the LMC disc (Z), as well as the three velocity components in cylindrical coordinates (Vϕ, VR, VZ).
Appendix C PM-based selection of cluster stars
Figure C.1 illustrates the procedure described in Sect. 2.2 to select likely cluster-member stars based on their measured relative PMs.
Appendix D Differential reddening correction
Figure D.1 illustrates the effect of our differential reddening corrections using the example of NGC 1751.
Appendix E Isochrone fitting results
Figure E.1 shows the results of the isochrone fitting for the cluster NGC 1978 as an example. The upper two panels show two different CMDs, with the best-fitting isochrone models over-plotted as a red solid line. Stars actually used for the fit are highlighted in green. The lower two panels show the corner plots of the posterior probability distribution. Figure E.2 presents for the remaining 18 clusters one representative CMD with the best-fitting isochrone.
Appendix F Orbit parameters of young clusters
Table F.1 lists the orbit parameters of the young star clusters in our sample, reporting for each cluster: the inclination angle, the maximum height above the LMC disc plane (Zmax), the apocentric distance (rapo), the eccentricity and the birth radius (R0).
Appendix G Orbits of young clusters assuming positions in the disc plane
Figure G.1 shows the reconstructed orbits of the six young (<1 Gyr) clusters within the LMC, now assuming that all clusters are currently located within the disc plane of the LMC.
Appendix H Model parameters for the LMC and SMC
Table H.1 lists the model parameters for the present-day positions and velocities of the LMC and SMC used as initial conditions for the dynamical models.
Observations of NGC 1751.
Observations of NGC 1818.
Positions and velocities of our sample of young and intermediate-age LMC star clusters.
Positions and velocities of the young and intermediate-age star clusters projected onto the reference frame of the LMC.
Orbital parameters of the young clusters.
Model parameters for the present-day positions and velocities of the LMC and SMC.
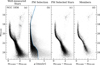 |
Fig. C.1 Selection of cluster member stars using the example of NGC 1856. (a) The mF814W vs mF438W–mF814W CMD of well-measured stars in the field of the cluster for which PMs have been determined (b) 1D relative PMs as a function of the mF814W magnitude. The blue line (drawn by hand) follows our selection of likely cluster members (black dots) based on their motions. The dependence on the magnitude is to account for the varying PM uncertainties as a function of magnitude. (c) CMD of PM-selected cluster members. (d) CMD of PM-selected cluster stars, including only stars within one effective radius from the cluster centre. |
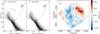 |
Fig. D.1 Illustration of the differential reddening correction towards NGC 1751. Panel (a) shows the original uncorrected mF814W vs mF435W − mF814W CMD of well-measured stars. Also shown as a red arrow is the direction of the reddening vector. Panel (b) shows the same CMD after the corrections for the effects of differential reddening have been applied. Panel (c) presents the resulting reddening map. The grey contours follow the density distribution of the reference stars used for the correction. |
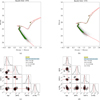 |
Fig. E.1 Isochrone fitting results using the example of NGC 1978. (a) Best-fit isochrone model in the mF438W vs mF438W − mF814W CMD. (b) Best-fit isochrone model in the mF814W vs mF438W − mF814W CMD. (c): Corner plot of the posterior probability distributions of pairwise model parameters for the mF438W vs mF438W − mF814W CMD. The best-fit parameters are quoted in the labels. (d): Same as (c) but for the mF814W vs mF438W − mF814W CMD. |
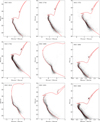 |
Fig. E.2 Representative CMDs for the clusters studied in this work. The best-fitting isochrone model for each cluster is shown as a red solid line. The names of the clusters are given in the top left corner within each panel. |
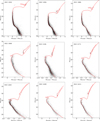 |
Fig. E.2 Continued. |
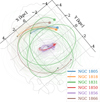 |
Fig. G.1 Similar to Fig. 2 but assuming all clusters are currently located within the disc plane of the LMC. The plot is oriented such that the LMC disc is seen directly from above, and north is to the top and east to the right. |
All Tables
Positions and velocities of our sample of young and intermediate-age LMC star clusters.
Positions and velocities of the young and intermediate-age star clusters projected onto the reference frame of the LMC.
Model parameters for the present-day positions and velocities of the LMC and SMC.
All Figures
|
Fig. 1 Velocities and positions of the young and intermediate-age clusters within the LMC as a function of the radial distance from the galaxy’s centre, R. In each panel, the clusters with less robust isochrone fits are denoted with diamond symbols and grey error bars. Panel a presents the tangential velocity, Vϕ. Theoretical circular velocities resulting from a pure NFW profile (orange solid line) and a model composed of a dark matter halo and a stellar disc and bar (green dashed line) are also shown. The size of the stellar bar is indicated by the vertical dashed line. Panel b shows the radial velocity, VR; the out-of-plane velocity, VZ, is presented in panel c; and panel d shows the vertical distance from the plane, Z. In all panels, the clusters are colour-coded by the logarithm of their ages (in years). |
| In the text | |
|
Fig. 2 Reconstructed orbits of the six young (<1 Gyr) clusters within the LMC. The orbits have been integrated backwards for the inferred lifetime of the clusters. The coloured circles represent their current positions within the galaxy and the black crosses indicate the birth places of the clusters. For orientation, the shown contours follow the density of the LMC field star population. The plot is oriented such that north is approximately to the top and east approximately to the left of the image. |
| In the text | |
|
Fig. 3 Age-metallicity relation of the young and intermediate-age clusters studied in this work. The clusters are colour-coded according to their cylindrical galactocentric distance, R. Clusters with less robust isochrone fits are illustrated with diamond symbols and grey error bars. Also shown are analytical models of the chemical evolution of the LMC (orange solid line) and SMC (green dashed line), assuming a bursting star formation rate (Pagel & Tautvaisiene 1998). |
| In the text | |
|
Fig. 4 Predictions for three individual model realisations with different LMC–SMC orbital histories. The upper row shows the vertical out-of-plane distance (Z) for each model, while the lower row presents the vertical out-of-plane velocity (VZ). The columns, from left to right, show the following model realisations for which the LMC experiences different interaction events with the SMC: only an SMC pericentre passage about 150 Myr ago with an impact parameter Zperi = −6.6 kpc; only an SMC pericentre passage, but now more recently, about 110 Myr ago with a smaller impact parameter of only Zperi = −2 kpc; two events of the SMC crossing the disc plane of the LMC at ∼340 Myr and ∼910 Myr ago, in addition to the SMC pericentre passage of the LMC ∼150 Myr ago. In the upper-right panel, the locations of the disc crossings are indicated with a blue and orange cross. The intermediate-age clusters in our sample are indicated by coloured circles, where the colour represents the measured out-of-plane distance Z (upper panels), and the out-of-plane velocity VZ (lower panels), respectively. Clusters with less robust isochrone fits are illustrated with diamond symbols. The black contours shown in all panels follow the stellar density of the LMC bar structure. |
| In the text | |
|
Fig. C.1 Selection of cluster member stars using the example of NGC 1856. (a) The mF814W vs mF438W–mF814W CMD of well-measured stars in the field of the cluster for which PMs have been determined (b) 1D relative PMs as a function of the mF814W magnitude. The blue line (drawn by hand) follows our selection of likely cluster members (black dots) based on their motions. The dependence on the magnitude is to account for the varying PM uncertainties as a function of magnitude. (c) CMD of PM-selected cluster members. (d) CMD of PM-selected cluster stars, including only stars within one effective radius from the cluster centre. |
| In the text | |
|
Fig. D.1 Illustration of the differential reddening correction towards NGC 1751. Panel (a) shows the original uncorrected mF814W vs mF435W − mF814W CMD of well-measured stars. Also shown as a red arrow is the direction of the reddening vector. Panel (b) shows the same CMD after the corrections for the effects of differential reddening have been applied. Panel (c) presents the resulting reddening map. The grey contours follow the density distribution of the reference stars used for the correction. |
| In the text | |
|
Fig. E.1 Isochrone fitting results using the example of NGC 1978. (a) Best-fit isochrone model in the mF438W vs mF438W − mF814W CMD. (b) Best-fit isochrone model in the mF814W vs mF438W − mF814W CMD. (c): Corner plot of the posterior probability distributions of pairwise model parameters for the mF438W vs mF438W − mF814W CMD. The best-fit parameters are quoted in the labels. (d): Same as (c) but for the mF814W vs mF438W − mF814W CMD. |
| In the text | |
|
Fig. E.2 Representative CMDs for the clusters studied in this work. The best-fitting isochrone model for each cluster is shown as a red solid line. The names of the clusters are given in the top left corner within each panel. |
| In the text | |
|
Fig. E.2 Continued. |
| In the text | |
|
Fig. G.1 Similar to Fig. 2 but assuming all clusters are currently located within the disc plane of the LMC. The plot is oriented such that the LMC disc is seen directly from above, and north is to the top and east to the right. |
| In the text | |
Current usage metrics show cumulative count of Article Views (full-text article views including HTML views, PDF and ePub downloads, according to the available data) and Abstracts Views on Vision4Press platform.
Data correspond to usage on the plateform after 2015. The current usage metrics is available 48-96 hours after online publication and is updated daily on week days.
Initial download of the metrics may take a while.