Fig. 3
Download original image
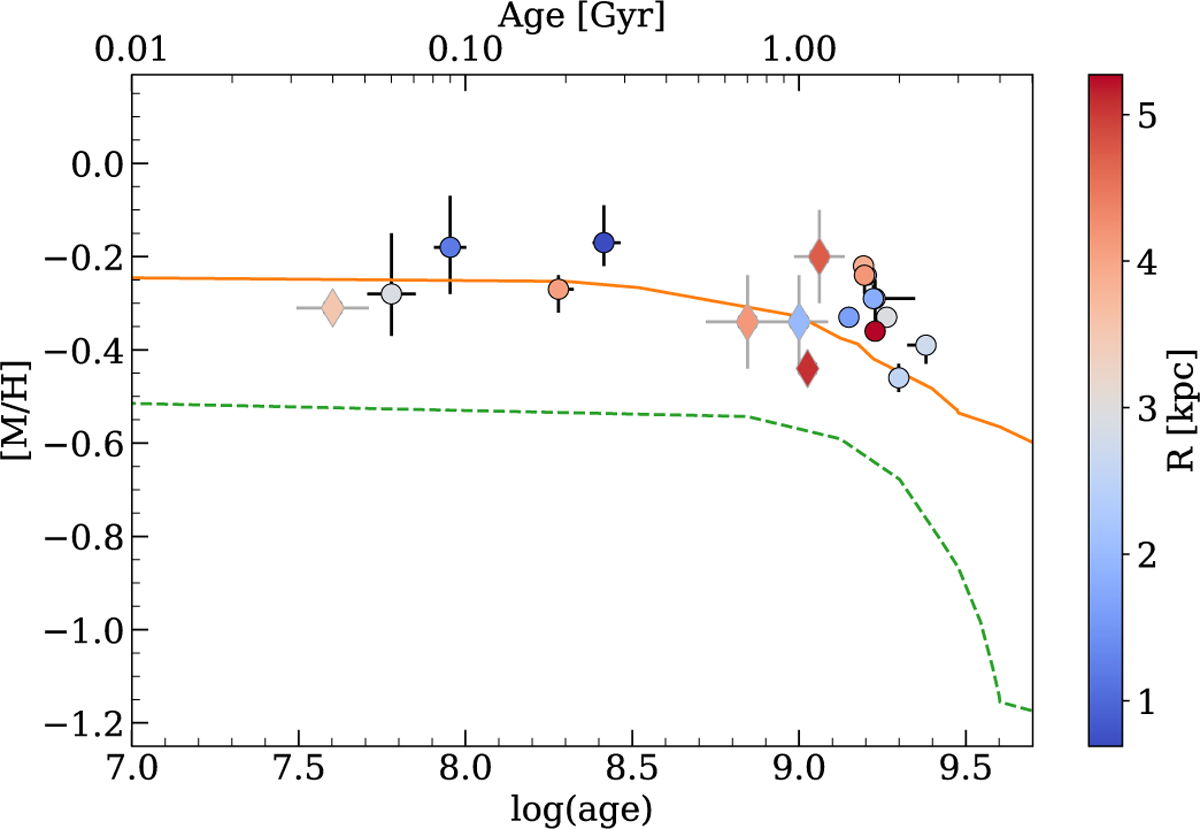
Age-metallicity relation of the young and intermediate-age clusters studied in this work. The clusters are colour-coded according to their cylindrical galactocentric distance, R. Clusters with less robust isochrone fits are illustrated with diamond symbols and grey error bars. Also shown are analytical models of the chemical evolution of the LMC (orange solid line) and SMC (green dashed line), assuming a bursting star formation rate (Pagel & Tautvaisiene 1998).
Current usage metrics show cumulative count of Article Views (full-text article views including HTML views, PDF and ePub downloads, according to the available data) and Abstracts Views on Vision4Press platform.
Data correspond to usage on the plateform after 2015. The current usage metrics is available 48-96 hours after online publication and is updated daily on week days.
Initial download of the metrics may take a while.