Fig. 4
Download original image
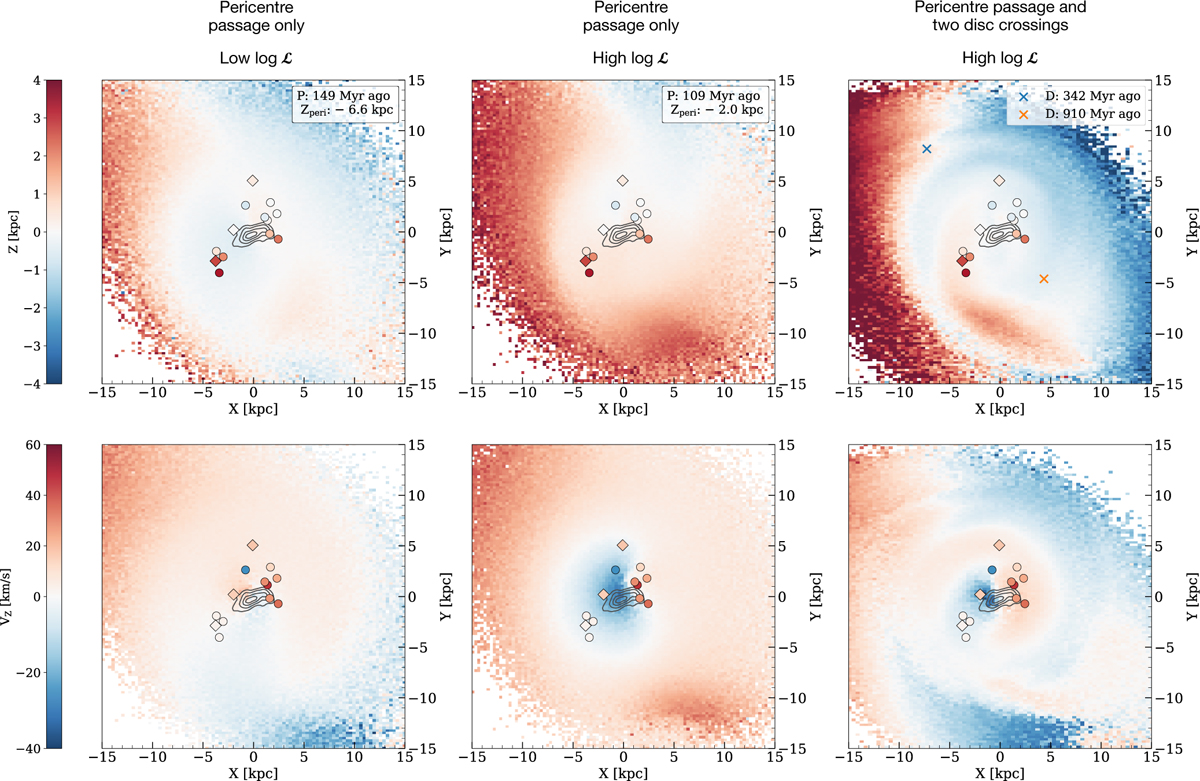
Predictions for three individual model realisations with different LMC–SMC orbital histories. The upper row shows the vertical out-of-plane distance (Z) for each model, while the lower row presents the vertical out-of-plane velocity (VZ). The columns, from left to right, show the following model realisations for which the LMC experiences different interaction events with the SMC: only an SMC pericentre passage about 150 Myr ago with an impact parameter Zperi = −6.6 kpc; only an SMC pericentre passage, but now more recently, about 110 Myr ago with a smaller impact parameter of only Zperi = −2 kpc; two events of the SMC crossing the disc plane of the LMC at ∼340 Myr and ∼910 Myr ago, in addition to the SMC pericentre passage of the LMC ∼150 Myr ago. In the upper-right panel, the locations of the disc crossings are indicated with a blue and orange cross. The intermediate-age clusters in our sample are indicated by coloured circles, where the colour represents the measured out-of-plane distance Z (upper panels), and the out-of-plane velocity VZ (lower panels), respectively. Clusters with less robust isochrone fits are illustrated with diamond symbols. The black contours shown in all panels follow the stellar density of the LMC bar structure.
Current usage metrics show cumulative count of Article Views (full-text article views including HTML views, PDF and ePub downloads, according to the available data) and Abstracts Views on Vision4Press platform.
Data correspond to usage on the plateform after 2015. The current usage metrics is available 48-96 hours after online publication and is updated daily on week days.
Initial download of the metrics may take a while.