Fig. 1
Download original image
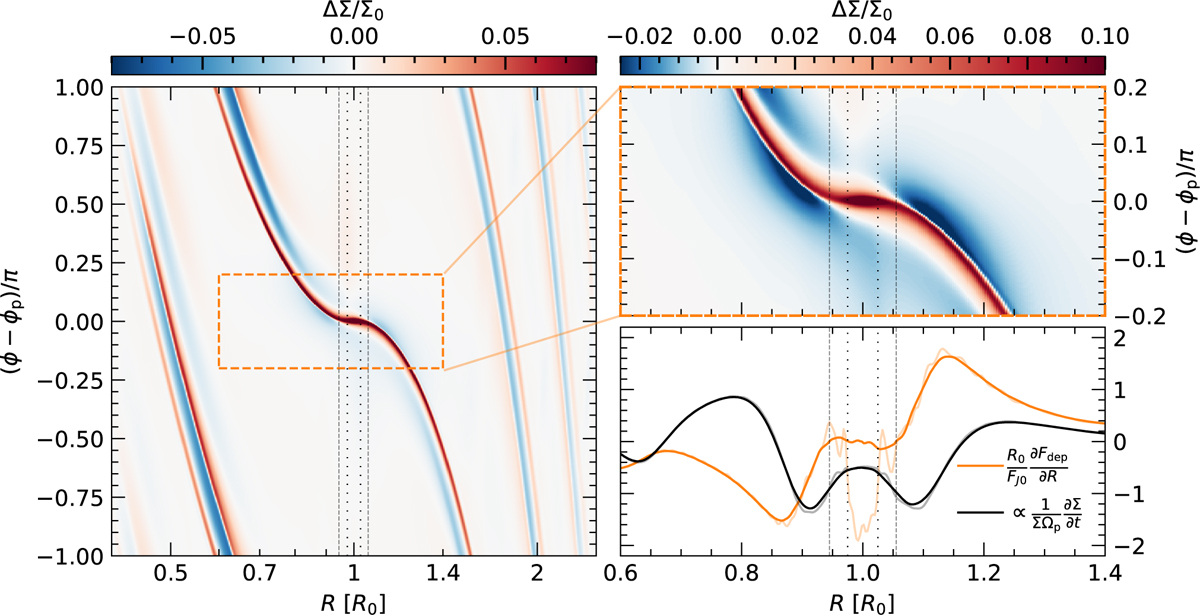
Snapshot of the perturbed surface density after ten planetary orbits for our locally isothermal 3D model. Left: entire simulation domain. Spiral shocks are weaker near either radial end of the disk due to wave damping. Top right: a zoom-in into the orange box on the left, highlighting the region where gap opening is driven. Bottom right: angular momentum deposition function ∂Fdep/∂R and the surface density evolution rate ∂ς/∂t in arbitrary units computed according to Cordwell & Rafikov (2024). Saturated and faded colors indicate smoothed or raw data, respectively. Dashed and dotted vertical lines mark the isothermal shock distance xsh (Eq. (15) with γ = 1) and the planet’s corotating region (Eq. (22) with γ = 1), respectively.
Current usage metrics show cumulative count of Article Views (full-text article views including HTML views, PDF and ePub downloads, according to the available data) and Abstracts Views on Vision4Press platform.
Data correspond to usage on the plateform after 2015. The current usage metrics is available 48-96 hours after online publication and is updated daily on week days.
Initial download of the metrics may take a while.