Fig. 4
Download original image
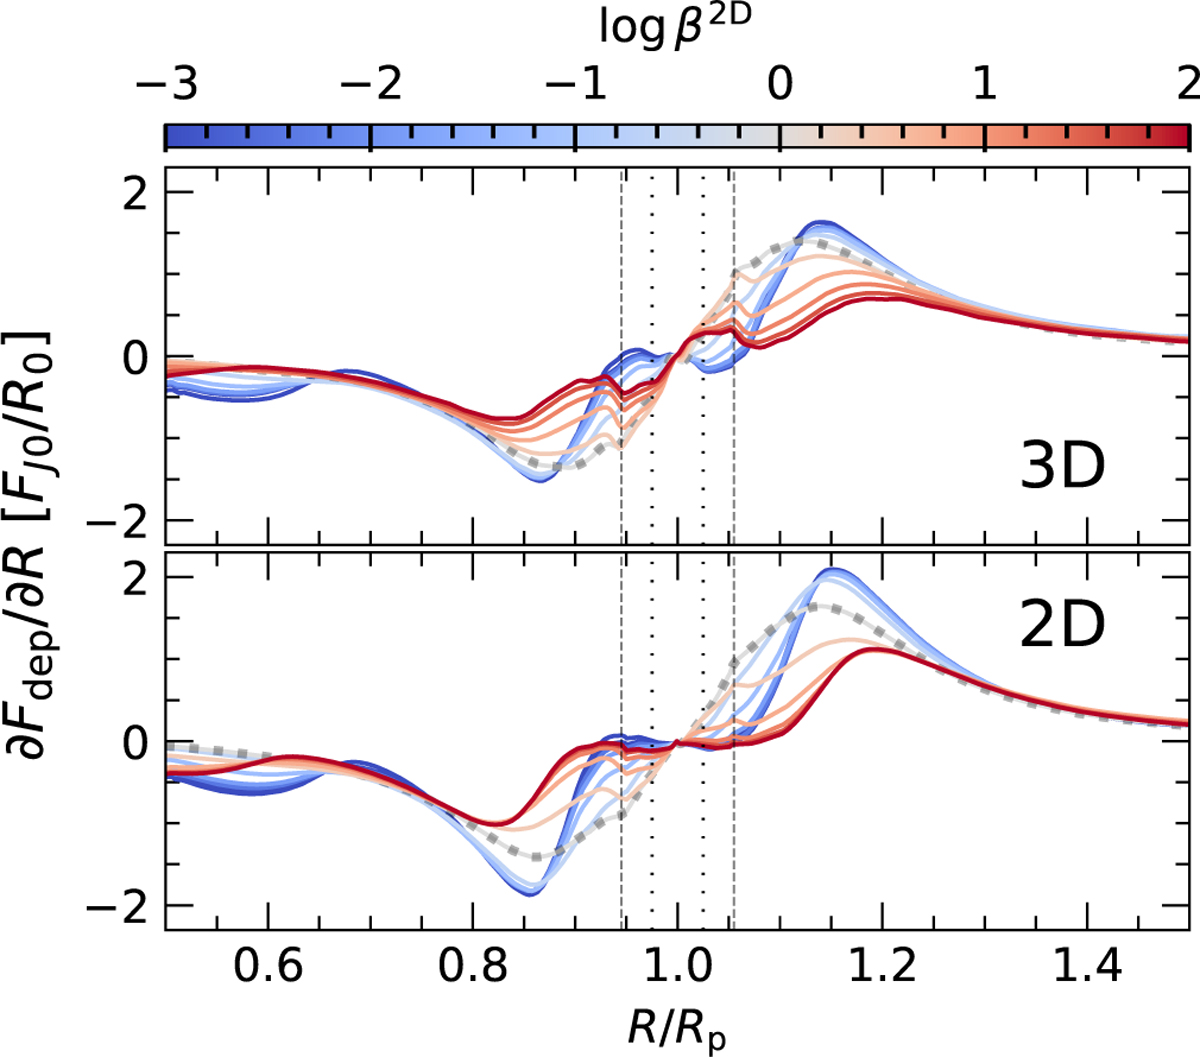
Angular momentum deposition function ∂Fdep/∂R for our 3D (top) and 2D models (bottom) as a function of the cooling timescale defined through Eqs. (11) and (13) for 3D and 2D, respectively. The quantity approaches zero within xsh (dashed vertical lines) for very short or very long cooling timescales (blue and red lines, respectively), but peaks around β ~ 1 (gray dots).
Current usage metrics show cumulative count of Article Views (full-text article views including HTML views, PDF and ePub downloads, according to the available data) and Abstracts Views on Vision4Press platform.
Data correspond to usage on the plateform after 2015. The current usage metrics is available 48-96 hours after online publication and is updated daily on week days.
Initial download of the metrics may take a while.