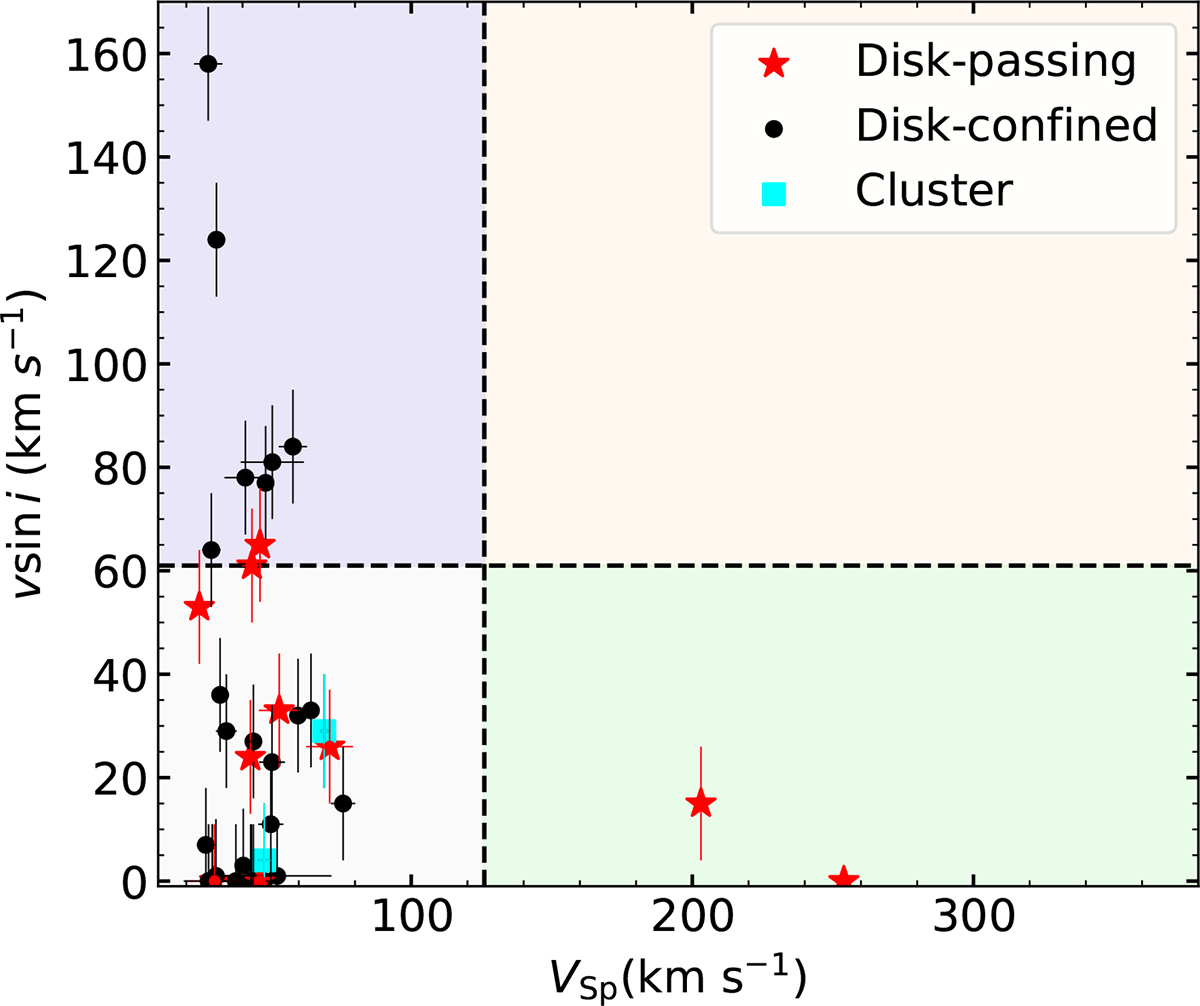
Fig. 8.
Download original image
Distribution of runaway stars in the VSp − v sin i plane. Stars with orbits remaining within the Galactic disk are marked as black dots, those with disk-passing orbits as red stars, and possible cluster-origin runaways as cyan squares. Thresholds of v sin i = 61 km s−1 and VSp = 126 km s−1 (dashed lines) represent the 3σ values obtained from Maxwellian fits to the observed distributions, as described in Sect. 4.3 of Guo et al. (2024).
Current usage metrics show cumulative count of Article Views (full-text article views including HTML views, PDF and ePub downloads, according to the available data) and Abstracts Views on Vision4Press platform.
Data correspond to usage on the plateform after 2015. The current usage metrics is available 48-96 hours after online publication and is updated daily on week days.
Initial download of the metrics may take a while.