| Issue |
A&A
Volume 705, January 2026
|
|
|---|---|---|
| Article Number | A178 | |
| Number of page(s) | 9 | |
| Section | Stellar structure and evolution | |
| DOI | https://doi.org/10.1051/0004-6361/202557420 | |
| Published online | 16 January 2026 | |
The origin of B-type runaway stars based on kinematics
1
Yunnan observatories, Chinese Academy of Sciences P.O. Box 110 Kunming 650011, China
2
International Centre of Supernovae, Yunnan Key Laboratory Kunming 650216, China
3
CAS Key Laboratory of Optical Astronomy, National Astronomical Observatories, Chinese Academy of Sciences Beijing 100101, People’s Republic of China
4
Department of Physics, Hebei Normal University Shijiazhuang 050024, People’s Republic of China
5
Shanghai NanHui High School Shanghai 200135, People’s Republic of China
6
Department of Astronomy, China West Normal University Nanchong 637002, People’s Republic of China
★ Corresponding authors: This email address is being protected from spambots. You need JavaScript enabled to view it.
; This email address is being protected from spambots. You need JavaScript enabled to view it.
Received:
26
September
2025
Accepted:
20
November
2025
Abstract
Context. Runaway stars depart their birthplaces with high peculiar velocities. Two mechanisms are commonly invoked to explain their origin, the binary supernova scenario and the dynamical ejection scenario. Investigating the kinematic properties of runaway stars is key to understanding their origins.
Aims. We investigated the origins of 39 B-type runaway stars from LAMOST using orbital traceback analysis.
Methods. From the LAMOST catalog, we selected 39 B-type runaway stars and determined their spectral subtypes from key absorption lines. We then derived atmospheric parameters for each star using the Stellar Label Machine, which is trained on TLUSTY synthetic spectra computed under the nonlocal thermodynamic equilibrium assumption. Using the derived atmospheric parameters as input, we estimated stellar masses and ages with a machine learning model trained on PARSEC evolutionary tracks. We finally performed orbital traceback with GALPY to analyze their origins.
Results. Through orbital traceback, we find that 29 stars have trajectories entirely within the Galactic disk, whereas 10are disk-passing yet still trace back to the disk. Two stars have trajectories that intersect those of known clusters. Their orbits show similar morphologies in both the X − Y and R − Z planes, and their [M/H] values are comparable, suggesting possible cluster origins. However, definitive confirmation will require additional evidence. In addition, the VSp − v sin i plane shows that runaway stars with low peculiar space velocities but high v sin i remain on the Galactic disk, whereas those with high peculiar space velocities but low v sin ipass through the disk, possibly reflecting two distinct origins.
Key words: methods: data analysis / methods: statistical / catalogs / surveys / stars: early-type / stars: kinematics and dynamics
© The Authors 2026
 Open Access article, published by EDP Sciences, under the terms of the Creative Commons Attribution License (https://creativecommons.org/licenses/by/4.0), which permits unrestricted use, distribution, and reproduction in any medium, provided the original work is properly cited.
This article is published in open access under the Subscribe to Open model. This email address is being protected from spambots. You need JavaScript enabled to view it. to support open access publication.
1. Introduction
Runaway stars rapidly depart from their natal clusters or associations, typically exhibiting peculiar velocities of about 30–40 km −1 (Blaauw & Morgan 1954; Gies & Bolton 1986; Hoogerwerf et al. 2000). Most observed runaway stars are massive early-type stars, with over 30% of O stars and approximately 5−10% of B stars considered to be runaways (Blaauw 1961; Stone 1979; Mdzinarishvili & Chargeishvili 2005; Carretero-Castrillo et al. 2023). While most runaway studies have focused on OB stars, cooler runaway stars such as A/F-type candidates have also been reported in the Milky Way and in the 30 Doradus region of the Large Magellanic Cloud (Maíz Apellániz et al. 2018; Teklehaimanot & Gebrehiwot 2024). Furthermore, more than half of the known massive runaway stars exhibit high surface helium abundances and rapid rotation (Cassinelli & Churchwell 1993; Hoogerwerf et al. 2000).
Two formation scenarios have been proposed to explain their origin. One is the binary supernova scenario (BSS), first proposed by Zwicky (1957) and later developed by Blaauw (1961), in which the more massive component of a binary first undergoes core collapse, leaving behind a compact object (a neutron star or black hole). If the supernova ejects more than half of the system’s total mass or imparts a significant natal kick to the remnant, the surviving companion is likely to become a runaway star (Renzo et al. 2019). Otherwise, if the system remains bound, the companion and compact object can form a runaway binary that is potentially observable as a high-mass X-ray binary (van den Heuvel et al. 2000). The other channel is the dynamical ejection scenario (DES; Poveda et al. 1967), in which early-type runaway stars are ejected from dense clusters or associations through gravitational interactions. Regarding the ejection mechanisms, binary–binary interactions are more efficient than binary–single star encounters (Hoffer 1983). Both the BSS and the DES are believed to occur, but their relative efficiencies have been debated for the past few decades (Sana et al. 2022; Chen et al. 2025).
Runaway stars formed via the DES and BSS can be distinguished in several ways. One common method for identifying runaway stars originating from the DES involves tracing back the kinematic trajectories of the stars to their parent clusters (Blaauw & Morgan 1954; Gies & Bolton 1986; Hoogerwerf et al. 2001). The chemical composition also provides valuable information. Although runaway stars from both formation scenarios typically retain their initial chemical abundances (McEvoy et al. 2017), supernova explosions in binary systems can result in α element enrichment in ejected stars (Przybilla et al. 2008; Irrgang et al. 2010). In addition, DES runaways typically have higher space velocities than BSS ones, while runaways with high v sin i are thought to arise mainly from the BSS (Sana et al. 2022).
The recent availability of extensive spectroscopic data from the Large Sky Area Multi-Object Fiber Spectroscopic Telescope (LAMOST) has provided an opportunity to investigate the origin of runaway stars (Cui et al. 2012; Zhao et al. 2012; Deng et al. 2012; Liu et al. 2020). Guo et al. (2024) identified 547 runaway stars from LAMOST Data Release 8 (DR8) and analyzed their statistical properties. Based on that catalog, Chen et al. (2025) investigated their binary fractions and evaluated the relative contributions of the BSS and DES formation scenarios. In this work we performed orbital traceback analysis for 39 B-type runaway stars from the sample identified by Guo et al. (2024) to investigate their origins.
The structure of this paper is as follows. We introduce the LAMOST data in Sect. 2. Section 3 presents the subclassification of the sample and the methods used to estimate its atmospheric and fundamental parameters Kinematic analyses and the corresponding results are presented in Sect. 4. Finally, our conclusions are summarized in Sect. 5.
2. Data
LAMOST is a 4-meter quasi-meridian reflecting Schmidt telescope located at the Xinglong station of the National Astronomical Observatories, China. The focal plane of the telescope offers a 5-degree field of view and can accommodate up to 4000 fibers (Cui et al. 2012; Zhao et al. 2012; Deng et al. 2012). Since 2012, LAMOST has conducted a Low-Resolution Spectroscopic (LRS) survey with a resolving power of R ∼ 1800 and a wavelength coverage of 3690 ∼ 9100 Å (Deng et al. 2012). In October 2018, LAMOST began a five-year Medium-Resolution Spectroscopic (MRS) survey aimed at conducting time-domain observations of objects in the Galactic region. The MRS spectra are captured with blue and red cameras, covering wavelength ranges of 4950 ∼ 5350 Å and 6300 ∼ 6800 Å, respectively (Liu et al. 2020).
By combining LAMOST DR8 radial velocities with Gaia DR3 astrometry, Guo et al. (2024) determined the peculiar tangential, radial, and space velocities of 4432 early-type stars. Following the approach of Berger & Gies (2001) and Wang et al.(2022), we identified 229 runaway stars with peculiar space velocities exceeding 43 km s−1, corresponding to approximately 1% of the peak of the fitted Maxwellian distribution of the space velocities. In addition, 480 further runaway candidates were selected based on their peculiar tangential velocities exceeding 33 km s−1, corresponding to approximately 1% of the peak of the fitted Maxwellian distribution of the tangential velocities. Because 162 sources are common to both subsamples, the final catalog comprises 547 runaway stars.
From this catalog, we selected 46 B-type runaway stars and determined their kinematic origins using orbital traceback. Although many studies restrict the definition of B stars to the B3–B9 range, we adopted the broader B0V–B9V range since our sample also includes three B2-type stars. The Gaia DR3 parallaxes as a function of G magnitude for the 46 runaway stars are shown in Fig. 1. Most objects are concentrated between G = 10 and 13 mag. Only four stars have G < 10 mag, two of which are at G = 9.94 mag, while the other two are somewhat brighter (G = 9.3 and G = 8.9 mag). In general, the magnitude distribution of our sample is nearly homogeneous.
We note that some objects within the OB temperature range could, in principle, be contaminated by blue horizontal branch (BHB) stars since the two populations exhibit similar surface gravities (Xue et al. 2008; Catelan 2009; Salgado et al. 2013; Guo et al. 2025). To assess this, we cross-matched our sample with the LAMOST BHB catalog (Vickers et al. 2021; Ju et al. 2024) and several other major BHB catalogs (Beers et al. 2007; Xue et al. 2008; Brown et al. 2008; Culpan et al. 2021), and found one overlapping source. This star has been removed from the final sample to avoid potential contamination, leaving 45 stars for further analysis.
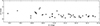 |
Fig. 1. Gaia DR3 parallaxes as a function of G magnitude. The error bars represent the parallax uncertainties. |
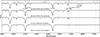 |
Fig. 2. Sample spectra spanning B3, B5, B7, and B9 subtypes, arranged from top to bottom. The key spectral lines He I 4026, 4121, 4471, 4713, Hδ 4101, Hγ 4340, and Mg II 4481 are labeled to highlight their variations across different subtypes. The RA and Dec of each target are listed below the corresponding spectrum. |
3. Method
3.1. Spectral classification
To obtain more precise atmospheric parameters, we cross-matched the 547 early-type star candidates with the LAMOST LRS DR10 and identified 123 matches. Because our analysis focuses on B-type runaway stars, we performed spectral subclassification of these spectra through visual inspection, following the MKCLASS-based criteria established for LAMOST OB stars by Liu et al. (2019), see their Table 2).
The classification criteria are summarized as follows: For B-type stars, the strengths of hydrogen Balmer lines (such as Hδ and Hγ) increase from spectral types B0 to B9. The neutral helium lines (He I 4026, 4121, 4471, and 4713 Å) first strengthen and then weaken, reaching a maximum intensity at B2 V. In contrast, the high-excitation Mg II 4481 Å line gradually strengthens throughout the B-type sequence. When this trend is not clearly visible, we also relied on specific absorption lines and line ratios as auxiliary criteria. For stars of types B2 to B9, the ratio of He I 4471 to Mg II 4481 generally decreases (Gray & Corbally 2009; Liu et al. 2019). Furthermore, for stars of the same spectral type, the strengths of the hydrogen Balmer lines generally decrease with luminosity from the main sequence to supergiants.
Based on these classification criteria and the LAMOST-LRS spectra1 from the LAMOST archive, we determined the spectral types for 45 B-type runaway stars, which are listed in Col. 9 of Table A.1. Figure 2 shows the spectra of five representative B-type stars (B3–B9) in the wavelength range of 3900–4750 Å, with some important spectral feature lines marked.
3.2. Atmospheric parameters
With the spectral subtypes established above, we derived atmospheric parameters for our B-type runaway stars, including effective temperature (Teff), surface gravity (log g), metallicity ([M/H]), and rotational velocity (v sin i), using the Stellar Label Machine (SLAM; Guo et al. 2021), a data-driven forward spectral model based on support vector regression (Zhang et al. 2020). It utilizes a training dataset constructed from TLUSTY synthetic spectra derived based on nonlocal thermodynamic equilibrium (NLTE) assumption (Zhang et al. 2020). The low-resolution spectra from LAMOST offered broad wavelength coverage, enabling better constraints to be placed on Teff, log g, and [M/H]. On the other hand, medium-resolution spectra (MRS) provided superior rotational velocity (v sin i) estimations due to higher resolution and detailed line profiles (Guo et al. 2021). Therefore, the values of Teff, log g, and [M/H] were derived from LRS spectra, while v sin i was calculated from MRS spectra. The typical uncertainties for LAMOST MRS are σ(Teff) = 2185 K, σ(V sin i) = 11 Km s−1 and σ(log g) = 0.29 cm s−2, while for LAMOST LRS are σ(Teff) = 1, 642 K, σ(V sin i) = 42 Km s−1 and σ(log g) = 0.25 cm s−2 (Guo et al. 2021). We omitted the broad diffuse interstellar bands of 4430, 5780, 6196, 6283, and 6614 Å (Herbig 1995; Guo et al. 2021). We provide two examples from our sample, illustrating the observed spectra (black lines) along with the corresponding best-fitting spectra (dashed red lines) derived using SLAM.
However, because the NLTE TLUSTY grid has a lower temperature bound of 15 000 K, using SLAM below this limit would involve extrapolation, which can introduce biases. In contrast, Xiang et al. (2022) provide local thermodynamic equilibrium atmospheric parameters based on ATLAS12 over 7500–60 000 K, so the 9000–15 000 K regime of our sample lies within their trained range, making those estimates more reliable (i.e., interpolation rather than extrapolation). Although NLTE effects are significant for early-type stars (Lanz & Hubeny 2007), an analysis of LAMOST LRS spectra by Xiang et al. (2022) shows that, for temperatures below 25 000 K, local thermodynamic equilibrium and NLTE determinations are in good agreement. Accordingly, for stars in our sample with Teff ≥ 15000 K, atmospheric parameters were derived using SLAM, while for those with Teff < 15000 K, we adopted the parameters provided by Xiang et al. (2022). The derived atmospheric parameters are listed in Table A.1.
3.3. Physical parameters
Using the atmospheric parameters obtained above, we derived the fundamental parameters, including masses and ages, for our sample following the method described by Li et al. (2025). This method employs a machine learning model implemented as a random-forest (RF) regression algorithm, which iteratively predicts stellar luminosity, mass and age based on atmospheric parameters. RF regression is an ensemble method that pools the outputs of thousands of decision trees, each grown on a random subset of the training sample, to yield a single, robust prediction. When the atmospheric parameters are fed in, every decision tree makes its own prediction, and the RF then averages them to obtain the final value. This averaging dampens the idiosyncrasies of single trees, cutting variance and yielding stable, accurate results even when the underlying relations are noisy or highly nonlinear (Li et al. 2025).
We used main-sequence stars extracted from the PARSEC 1.2S (Bressan et al. 2012; Chen et al. 2014; Fu et al. 2018) as the training grid for the RF algorithm. The training grid comprises a grid of stellar parameters covering 7000 K < Teff < 49 000 K, 0.55 < log g < 4.52 dex, and −0.6 < [M/H]< 0.6 dex. The process begins with the prediction of luminosity using Teff, log g and [M/H]. This predicted luminosity, along with Teff, log g and [M/H], is then used to predict stellar mass. Finally, the model predicts stellar age based on Teff, log g, [M/H], as well as the previously derived luminosity and mass. Validation of the method shows that the uncertainty of mass prediction is 9%, whereas the age dispersion is 0.44 Gyr. The larger dispersion in age prediction arises from poorly constrained metallicity in early-type stars and the inherent age–metallicity degeneracy.
The derived masses and ages are presented in Table A.1. Figure 3 illustrates the PARSEC1.2S training grid in the log g–Teff plane, color-coded by stellar mass. Our predicted sources are overplotted as black symbols using the same mass color scale. Crosses mark stars located within the training grid (“high certainty”), whereas triangles correspond to extrapolated objects outside the grid (“low certainty”). These two cases are also flagged as “I” (inside) and “O” (outside) in Table A.1. From the figure, six stars are found to lie outside the training grid – one of them have Teff and log g within the grid boundaries but fall outside in [M/H]. Since the RF model extrapolates for these out-of-range inputs, their predicted masses and ages are deemed unreliable, and sources marked with a triangle are also considered to lie outside the main-sequence phase. Four of these outliers exhibit unusually high inferred masses (> 16 M⊙), further supporting their exclusion. Therefore, we removed these six stars from the subsequent analysis, resulting in a final sample of 39 B-type runaway stars.
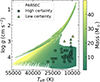 |
Fig. 3. Training grid and predicted sample in the log g–Teff plane. The background shows the PARSEC 1.2S main-sequence grid color-coded by stellar mass. The black crosses and triangles represent our 45 B-type runaway stars, with colors corresponding to their predicted masses using the same color scale. Crosses denote stars within the parameter range of the training grid (high certainty), while triangles indicate extrapolated sources outside the grid (low certainty). |
3.4. Orbital trajectories
Having derived the atmospheric and fundamental parameters, we used the Python package GALPY (Bovy 2015) to calculate the Galactic trajectories of our stars. Proper motions were retrieved from Gaia Early Data Release 3 (Gaia Collaboration 2021), and distances were obtained from the posterior distribution of geometric distances by Bailer-Jones et al. (2021), while radial velocities and peculiar space velocities (VSp) were taken from Guo et al. (2024). We adopted the solar motion of (U⊙,V⊙,W⊙) = (11.10, 12.24, 7.25) km s−1 from Schönrich et al. (2010) and both the solar Galactocentric distance (R0) of 8.5 kpc and the circular Galactic rotational velocity (Vc) of 220 km s−1 from Kerr & Lynden-Bell (1986), see Guo et al. 2024). We determined the uncertainties in the birthplaces of the 39 stars by conducting Monte Carlo simulations, assuming Gaussian error distributions for distances, proper motions, radial velocities, and ages (Liu et al. 2023).
4. Results
4.1. Orbital trajectories of stars
Although the Milky Way’s disk flare and warp cause the exponential scale-height to increase with Galactocentric radius, reported values vary among studies because they use different populations and methods (López-Corredoira & Molgó 2014; Wang et al. 2018a; Yu et al. 2021). Based on LAMOST DR5 OB stars, Yu et al. (2021) derived a scale-height increasing from 0.14 to 0.5 kpc over R = 8–14 kpc, similar to the thin disk values reported by Wang et al. (2018a). For the thick disk, López-Corredoira & Molgó (2014) and Wang et al. (2018b) reported scale-heights of 0.5–1.5 kpc over R= 8–20 kpc. Considering the different scale heights of the thin and thick disks, and the R distribution of our sample, we adopted |Z| = 0.5 kpc2 as the threshold to distinguish disk objects (Liu et al. 2023). Notably, there is no rigid border orthogonal to the Galactic disk, and in a disk population with a given scale height, about 30% of the stars may extend beyond that height.
After computing the Galactic orbits of our stars, we present the trajectories of four example stars in Figs. 4 and 5, shown in the Galactic X − Y and R − Z planes, with travel time defined as the elapsed time for a star to move from its birthplace to its current position. Figure 4 shows two examples of stars for which there is no significant change between their current locations and their birthplaces and their orbits remain confined within |Z|< 0.5 kpc, supporting a disk origin. In total, 29 stars exhibit this behavior. In the top panel of Fig. 5, although the trajectories pass through the disk, the birthplaces of stars can still be traced back to within |Z|< 0.5 kpc, and 9 stars in our sample fall into this category. Notably, we use the term “pass through the disk” (or “disk-passing”) to describe stars whose orbits pass the Galactic disk region (defined here as being within |Z|< = 0.5 kpc), which can involve passing through and leaving the disk or possibly returning to it at a later time. In the bottom panel of Fig. 5, the birthplace of this star is closer to the disk edge, but after considering the Monte Carlo uncertainties, they can still be regarded as having a disk origin. We have one such source. In summary, 29 stars have trajectories entirely confined within the disk, while 10 stars have trajectories that pass through the disk but can still be considered to have a disk origin.
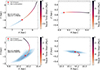 |
Fig. 4. Orbital trajectories for two example stars with coordinates RA: 57.671321, Dec: 57.178426 (top panels) and RA: 41.448800, Dec: 54.544701 (bottom panels), shown in the Galactic X − Y plane (left panels) and the Galactic R − Z plane (right panels). The color scale indicates travel time (in Myr), with the red star marking each star’s birthplace and the black “x” marking its current position. The red-shaded contours denote the uncertainty regions of the birthplaces. |
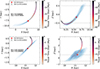 |
Fig. 5. Same as Fig. 4 but for stars with coordinates RA: 19.599800, Dec: 43.974800 (top panels) and RA: 140.390003, Dec: 50.098992 (bottom panels). |
4.2. Possible cluster origin
To investigate potential DESs, we cross-matched our sample of 39 stars with cluster catalogs (Castro-Ginard et al. 2019, 2020; Hunt & Reffert 2023) and found that the trajectories of only two sources intersect with those of clusters. We also used the Python package GALPY (Bovy 2015) to calculate the Galactic trajectories for the two matched clusters; we show the results in Figs. 6 and 7.
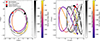 |
Fig. 6. Orbital trajectories of IC 1311 and its matched star (RA = 102.263087, Dec = 41.981471) in Galactic coordinates. We show the orbits of the star (colored by travel time in Myr) and the cluster (in grayscale) in the Galactic X − Y (left) and Galactic R − Z projections (right). The red star and red circle mark the birthplaces of the star and cluster, while the black cross and black circle indicate their current positions. The colorbars indicate the look-back time along each orbit, with negative values corresponding to earlier times. |
Figure 6 displays the orbital trajectories of a star with RA = 102.2630, Dec = 41.9814 and its matched cluster IC 1311. The star has Teff= 10 339 K, log g= 3.65, and [M/H] = − 0.48, while the metallicity of IC 1311 is [M/H] = − 0.30 ± 0.16 as reported by Warren & Cole (2009). In the Galactic X − Y plane, both the star and the cluster move counterclockwise, while in the R − Z plane their trajectories broadly overlap. The similarity between their orbital trajectories and metallicities may suggest that the star originated from the cluster.
Figure 7 displays the orbital trajectories of a star with RA = 41.4488, Dec = 54.5447 and its matched cluster NGC 2236. The star has Teff = 9890 K, log g = 3.87, and [M/H] = − 0.28. The metallicity of NGC 2236 is [M/H] = − 0.19 ± 0.08 as reported by Zhong et al. (2020). The orbital trajectories in Fig. 7 show that the star was initially close to NGC 2236, but later moved away from the cluster’s orbit in the R–Z projection. This may suggest that the star was ejected from the cluster. Notably, definitive confirmation would require further evidence. As noted by Hoogerwerf et al. (2001), compelling evidence for the DES involves finding a common site of origin for the individual components of the encounter.
4.3. Statistical properties
Figure 8 presents the distribution of runaway stars in the VSp − v sin i plane. It shows that the majority of B-type runaways lie in the gray region, corresponding to low peculiar space velocities and low v sin i. The disk-confined subsample (black dots) has relatively low peculiar space velocities and spans a wide range of v sin i, whereas the disk-passing subsample (red stars) tends to have higher VSp while maintaining low v sin i. According to Sana et al. (2022), slow-moving, rapidly rotating runaways point to the BSS, while fast-moving, slowly rotating runaways are more consistent with the DES. Rapidly rotating runaway stars are interpreted as products of close binary interactions, such as stellar mergers (Podsiadlowski et al. 1992; Tylenda et al. 2011) or mass transfer (Packet 1981; Petrovic et al. 2005), which can significantly increase the rotational velocity (Sana et al. 2022). By contrast, the DES involves close multi-body encounters that impart large VSp without significantly spinning up the ejected stars (Sana et al. 2022). In addition, stars with a possible BSS origin tend to be disk-confined, whereas those with a possible DES origin are disk-passing. While our orbital traceback provides statistical support for these trends, more definitive conclusions will require high-resolution spectroscopic data in future work.
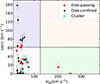 |
Fig. 8. Distribution of runaway stars in the VSp − v sin i plane. Stars with orbits remaining within the Galactic disk are marked as black dots, those with disk-passing orbits as red stars, and possible cluster-origin runaways as cyan squares. Thresholds of v sin i = 61 km s−1 and VSp = 126 km s−1 (dashed lines) represent the 3σ values obtained from Maxwellian fits to the observed distributions, as described in Sect. 4.3 of Guo et al. (2024). |
5. Summary
Runaway stars rapidly escape from their birth clusters or associations, typically with peculiar velocities of 30–40 km/s. Two mechanisms are typically considered, the BSS and the DES, but their relative contributions remain uncertain. Determining the origins of runaways may provide constraints on binary evolution and dynamical processes.
In this work we investigated the kinematic origins of 39 B-type runaway stars identified by Guo et al. (2024). We determined spectral subclasses from key absorption lines and derived atmospheric parameters with SLAM. We then estimated fundamental parameters using a machine learning model trained on these parameters. Using GALPY, we computed each star’s Galactic trajectory: we find that 29 stars remain fully confined to the disk and 10 have disk-passing orbits yet still trace back to the disk. Two of these may be consistent with a cluster origin, although a definitive confirmation would require further evidence. We also find a feature in the VSp − v sin i plane: low-VSp, high-v sin i runaways are typically disk-confined, whereas high-VSp, low-v sin i runaways are disk-passing. This probably reflects two different origins. This may provide new kinematic evidence that can be used to distinguish between the BSS and the DES. However, our conclusions are limited by the lack of high-resolution spectroscopic abundances. Future surveys with higher-precision spectroscopy will be crucial to establishing firmer constraints on the origins of runaway stars and their role in binary evolution and cluster dynamics.
Acknowledgments
This work is supported by the National Natural Science Foundation of China (Nos. 12288102, 12125303, 12090040/3, 12103064, 12403039, 12373036), the National Key R&D Program of China (grant Nos. 2021YFA1600403/1, 2021YFA1600400), and the Natural Science Foundation of Yunnan Province (Nos. 202201BC070003, 202001AW070007), the International Centre of Supernovae, Yunnan Key Laboratory (No. 202302AN360001), the “Yunnan Revitalization Talent Support Program”-Science, Technology Champion Project (N0. 202305AB350003), and Yunnan Fundamental Research Projects (grant Nos. 202501CF070018). This work has been supported by the New Cornerstone Science Foundation through the XPLORER Prize.
References
- Bailer-Jones, C. A. L., Rybizki, J., Fouesneau, M., Demleitner, M., & Andrae, R. 2021, AJ, 161, 147 [Google Scholar]
- Beers, T. C., Almeida, T., Rossi, S., Wilhelm, R., & Marsteller, B. 2007, ApJS, 168, 277 [NASA ADS] [CrossRef] [Google Scholar]
- Berger, D. H., & Gies, D. R. 2001, ApJ, 555, 364 [Google Scholar]
- Blaauw, A. 1961, Bull. Astron. Inst. Netherlands, 15, 265 [NASA ADS] [Google Scholar]
- Blaauw, A., & Morgan, W. W. 1954, ApJ, 119, 625 [NASA ADS] [CrossRef] [Google Scholar]
- Bovy, J. 2015, ApJS, 216, 29 [NASA ADS] [CrossRef] [Google Scholar]
- Bressan, A., Marigo, P., Girardi, L., et al. 2012, MNRAS, 427, 127 [NASA ADS] [CrossRef] [Google Scholar]
- Brown, W. R., Beers, T. C., Wilhelm, R., et al. 2008, AJ, 135, 564 [NASA ADS] [CrossRef] [Google Scholar]
- Carretero-Castrillo, M., Ribó, M., & Paredes, J. M. 2023, A&A, 679, A109 [NASA ADS] [CrossRef] [EDP Sciences] [Google Scholar]
- Cassinelli, J. P., & Churchwell, E. B. 1993, Massive Stars: Their Lives in the Interstellar Medium, 35 [Google Scholar]
- Castro-Ginard, A., Jordi, C., Luri, X., Cantat-Gaudin, T., & Balaguer-Núñez, L. 2019, A&A, 627, A35 [NASA ADS] [CrossRef] [EDP Sciences] [Google Scholar]
- Castro-Ginard, A., Jordi, C., Luri, X., et al. 2020, A&A, 635, A45 [NASA ADS] [CrossRef] [EDP Sciences] [Google Scholar]
- Catelan, M. 2009, Ap&SS, 320, 261 [Google Scholar]
- Chen, Y., Girardi, L., Bressan, A., et al. 2014, MNRAS, 444, 2525 [Google Scholar]
- Chen, K., Guo, Y., Jiang, D., Han, Z., & Chen, X. 2025, ApJ, 988, 228 [Google Scholar]
- Cui, X.-Q., Zhao, Y.-H., Chu, Y.-Q., et al. 2012, Res. Astron. Astrophys., 12, 1197 [Google Scholar]
- Culpan, R., Pelisoli, I., & Geier, S. 2021, A&A, 654, A107 [NASA ADS] [CrossRef] [EDP Sciences] [Google Scholar]
- Deng, L.-C., Newberg, H. J., Liu, C., et al. 2012, Res. Astron. Astrophys., 12, 735 [Google Scholar]
- Fu, X., Bressan, A., Marigo, P., et al. 2018, MNRAS, 476, 496 [NASA ADS] [CrossRef] [Google Scholar]
- Gaia Collaboration (Brown, A. G. A., et al.) 2021, A&A, 649, A1 [NASA ADS] [CrossRef] [EDP Sciences] [Google Scholar]
- Gies, D. R., & Bolton, C. T. 1986, ApJS, 61, 419 [Google Scholar]
- Gray, R. O., & Corbally, C. j. 2009, Stellar Spectral Classification (Princeton University Press) [Google Scholar]
- Guo, Y., Zhang, B., Liu, C., et al. 2021, ApJS, 257, 54 [NASA ADS] [CrossRef] [Google Scholar]
- Guo, Y., Wang, L., Liu, C., et al. 2024, ApJS, 272, 45 [Google Scholar]
- Guo, Y., Chen, K., Li, Z., et al. 2025, A&A, 702, A11 [NASA ADS] [CrossRef] [EDP Sciences] [Google Scholar]
- Herbig, G. H. 1995, ARA&A, 33, 19 [Google Scholar]
- Hoffer, J. B. 1983, AJ, 88, 1420 [Google Scholar]
- Hoogerwerf, R., de Bruijne, J. H. J., & de Zeeuw, P. T. 2000, ApJ, 544, L133 [NASA ADS] [CrossRef] [Google Scholar]
- Hoogerwerf, R., de Bruijne, J. H. J., & de Zeeuw, P. T. 2001, A&A, 365, 49 [NASA ADS] [CrossRef] [EDP Sciences] [Google Scholar]
- Hunt, E. L., & Reffert, S. 2023, A&A, 673, A114 [NASA ADS] [CrossRef] [EDP Sciences] [Google Scholar]
- Irrgang, A., Przybilla, N., Heber, U., Nieva, M. F., & Schuh, S. 2010, ApJ, 711, 138 [Google Scholar]
- Ju, J., Cui, W., Huo, Z., et al. 2024, ApJS, 270, 11 [Google Scholar]
- Kerr, F. J., & Lynden-Bell, D. 1986, MNRAS, 221, 1023 [NASA ADS] [CrossRef] [Google Scholar]
- Lanz, T., & Hubeny, I. 2007, ApJS, 169, 83 [CrossRef] [Google Scholar]
- Li, Q., Xiong, J., Li, J., et al. 2025, ApJS, 276, 19 [Google Scholar]
- Liu, Z., Cui, W., Liu, C., et al. 2019, ApJS, 241, 32 [CrossRef] [Google Scholar]
- Liu, C., Fu, J., Shi, J., et al. 2020, ArXiv e-prints [arXiv:2005.07210] [Google Scholar]
- Liu, Z., Cui, W., Zhao, G., et al. 2023, MNRAS, 519, 995 [Google Scholar]
- López-Corredoira, M., & Molgó, J. 2014, A&A, 567, A106 [NASA ADS] [CrossRef] [EDP Sciences] [Google Scholar]
- Maíz Apellániz, J., Pantaleoni González, M., Barbá, R. H., et al. 2018, A&A, 616, A149 [NASA ADS] [CrossRef] [EDP Sciences] [Google Scholar]
- McEvoy, C. M., Dufton, P. L., Smoker, J. V., et al. 2017, ApJ, 842, 32 [NASA ADS] [CrossRef] [Google Scholar]
- Mdzinarishvili, T. G., & Chargeishvili, K. B. 2005, A&A, 431, L1 [NASA ADS] [CrossRef] [EDP Sciences] [Google Scholar]
- Packet, W. 1981, A&A, 102, 17 [NASA ADS] [Google Scholar]
- Petrovic, J., Langer, N., & van der Hucht, K. A. 2005, A&A, 435, 1013 [NASA ADS] [CrossRef] [EDP Sciences] [Google Scholar]
- Podsiadlowski, P., Joss, P. C., & Hsu, J. J. L. 1992, ApJ, 391, 246 [Google Scholar]
- Poveda, A., Ruiz, J., & Allen, C. 1967, Boletin de los Observatorios Tonantzintla y Tacubaya, 4, 86 [Google Scholar]
- Przybilla, N., Fernanda Nieva, M., Heber, U., & Butler, K. 2008, ApJ, 684, L103 [Google Scholar]
- Renzo, M., Zapartas, E., de Mink, S. E., et al. 2019, A&A, 624, A66 [NASA ADS] [CrossRef] [EDP Sciences] [Google Scholar]
- Salgado, C., Moni Bidin, C., Villanova, S., Geisler, D., & Catelan, M. 2013, A&A, 559, A101 [NASA ADS] [CrossRef] [EDP Sciences] [Google Scholar]
- Sana, H., Ramírez-Agudelo, O. H., Hénault-Brunet, V., et al. 2022, A&A, 668, L5 [NASA ADS] [CrossRef] [EDP Sciences] [Google Scholar]
- Schönrich, R., Binney, J., & Dehnen, W. 2010, MNRAS, 403, 1829 [NASA ADS] [CrossRef] [Google Scholar]
- Stone, R. C. 1979, ApJ, 232, 520 [NASA ADS] [CrossRef] [Google Scholar]
- Teklehaimanot, B. T., & Gebrehiwot, Y. M. 2024, New Astron., 106, 102128 [Google Scholar]
- Tylenda, R., Hajduk, M., Kamiński, T., et al. 2011, A&A, 528, A114 [NASA ADS] [CrossRef] [EDP Sciences] [Google Scholar]
- van den Heuvel, E. P. J., Portegies Zwart, S. F., Bhattacharya, D., & Kaper, L. 2000, A&A, 364, 563 [NASA ADS] [Google Scholar]
- Vickers, J. J., Li, Z.-Y., Smith, M. C., & Shen, J. 2021, ApJ, 912, 32 [NASA ADS] [CrossRef] [Google Scholar]
- Wang, H., López-Corredoira, M., Carlin, J. L., & Deng, L. 2018a, MNRAS, 477, 2858 [Google Scholar]
- Wang, H.-F., Liu, C., Xu, Y., Wan, J.-C., & Deng, L. 2018b, MNRAS, 478, 3367 [NASA ADS] [CrossRef] [Google Scholar]
- Wang, L., Li, J., Wu, Y., et al. 2022, ApJS, 260, 35 [NASA ADS] [CrossRef] [Google Scholar]
- Warren, S. R., & Cole, A. A. 2009, MNRAS, 393, 272 [NASA ADS] [CrossRef] [Google Scholar]
- Xiang, M., Rix, H.-W., Ting, Y.-S., et al. 2022, A&A, 662, A66 [NASA ADS] [CrossRef] [EDP Sciences] [Google Scholar]
- Xue, X. X., Rix, H. W., Zhao, G., et al. 2008, ApJ, 684, 1143 [Google Scholar]
- Yu, Y., Wang, H.-F., Cui, W.-Y., et al. 2021, ApJ, 922, 80 [NASA ADS] [CrossRef] [Google Scholar]
- Zhang, B., Liu, C., & Deng, L.-C. 2020, ApJS, 246, 9 [NASA ADS] [CrossRef] [Google Scholar]
- Zhao, G., Zhao, Y.-H., Chu, Y.-Q., Jing, Y.-P., & Deng, L.-C. 2012, Res. Astron. Astrophys., 12, 723 [NASA ADS] [CrossRef] [Google Scholar]
- Zhong, J., Chen, L., Wu, D., et al. 2020, A&A, 640, A127 [NASA ADS] [CrossRef] [EDP Sciences] [Google Scholar]
- Zwicky, F. 1957, Morphological Astronomy (Springer) [Google Scholar]
We used the python package laspec from https://github.com/hypergravity/laspec to normalize the spectra using a spline fit.
We also tested a smaller boundary of |Z| = 0.14 kpc and found that, when considering the uncertainties in the birth positions, all of our stars still originate from within the Galactic disk.
Appendix A: Table
The predicted parameters of B-type runaway stars.
All Tables
All Figures
|
Fig. 1. Gaia DR3 parallaxes as a function of G magnitude. The error bars represent the parallax uncertainties. |
| In the text | |
|
Fig. 2. Sample spectra spanning B3, B5, B7, and B9 subtypes, arranged from top to bottom. The key spectral lines He I 4026, 4121, 4471, 4713, Hδ 4101, Hγ 4340, and Mg II 4481 are labeled to highlight their variations across different subtypes. The RA and Dec of each target are listed below the corresponding spectrum. |
| In the text | |
|
Fig. 3. Training grid and predicted sample in the log g–Teff plane. The background shows the PARSEC 1.2S main-sequence grid color-coded by stellar mass. The black crosses and triangles represent our 45 B-type runaway stars, with colors corresponding to their predicted masses using the same color scale. Crosses denote stars within the parameter range of the training grid (high certainty), while triangles indicate extrapolated sources outside the grid (low certainty). |
| In the text | |
|
Fig. 4. Orbital trajectories for two example stars with coordinates RA: 57.671321, Dec: 57.178426 (top panels) and RA: 41.448800, Dec: 54.544701 (bottom panels), shown in the Galactic X − Y plane (left panels) and the Galactic R − Z plane (right panels). The color scale indicates travel time (in Myr), with the red star marking each star’s birthplace and the black “x” marking its current position. The red-shaded contours denote the uncertainty regions of the birthplaces. |
| In the text | |
|
Fig. 5. Same as Fig. 4 but for stars with coordinates RA: 19.599800, Dec: 43.974800 (top panels) and RA: 140.390003, Dec: 50.098992 (bottom panels). |
| In the text | |
|
Fig. 6. Orbital trajectories of IC 1311 and its matched star (RA = 102.263087, Dec = 41.981471) in Galactic coordinates. We show the orbits of the star (colored by travel time in Myr) and the cluster (in grayscale) in the Galactic X − Y (left) and Galactic R − Z projections (right). The red star and red circle mark the birthplaces of the star and cluster, while the black cross and black circle indicate their current positions. The colorbars indicate the look-back time along each orbit, with negative values corresponding to earlier times. |
| In the text | |
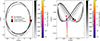 |
Fig. 7. Same as Fig. 6 but for NGC 2236 and its matched star (RA = 41.4488, Dec = 54.5447). |
| In the text | |
|
Fig. 8. Distribution of runaway stars in the VSp − v sin i plane. Stars with orbits remaining within the Galactic disk are marked as black dots, those with disk-passing orbits as red stars, and possible cluster-origin runaways as cyan squares. Thresholds of v sin i = 61 km s−1 and VSp = 126 km s−1 (dashed lines) represent the 3σ values obtained from Maxwellian fits to the observed distributions, as described in Sect. 4.3 of Guo et al. (2024). |
| In the text | |
Current usage metrics show cumulative count of Article Views (full-text article views including HTML views, PDF and ePub downloads, according to the available data) and Abstracts Views on Vision4Press platform.
Data correspond to usage on the plateform after 2015. The current usage metrics is available 48-96 hours after online publication and is updated daily on week days.
Initial download of the metrics may take a while.