Open Access
Fig. 11
Download original image
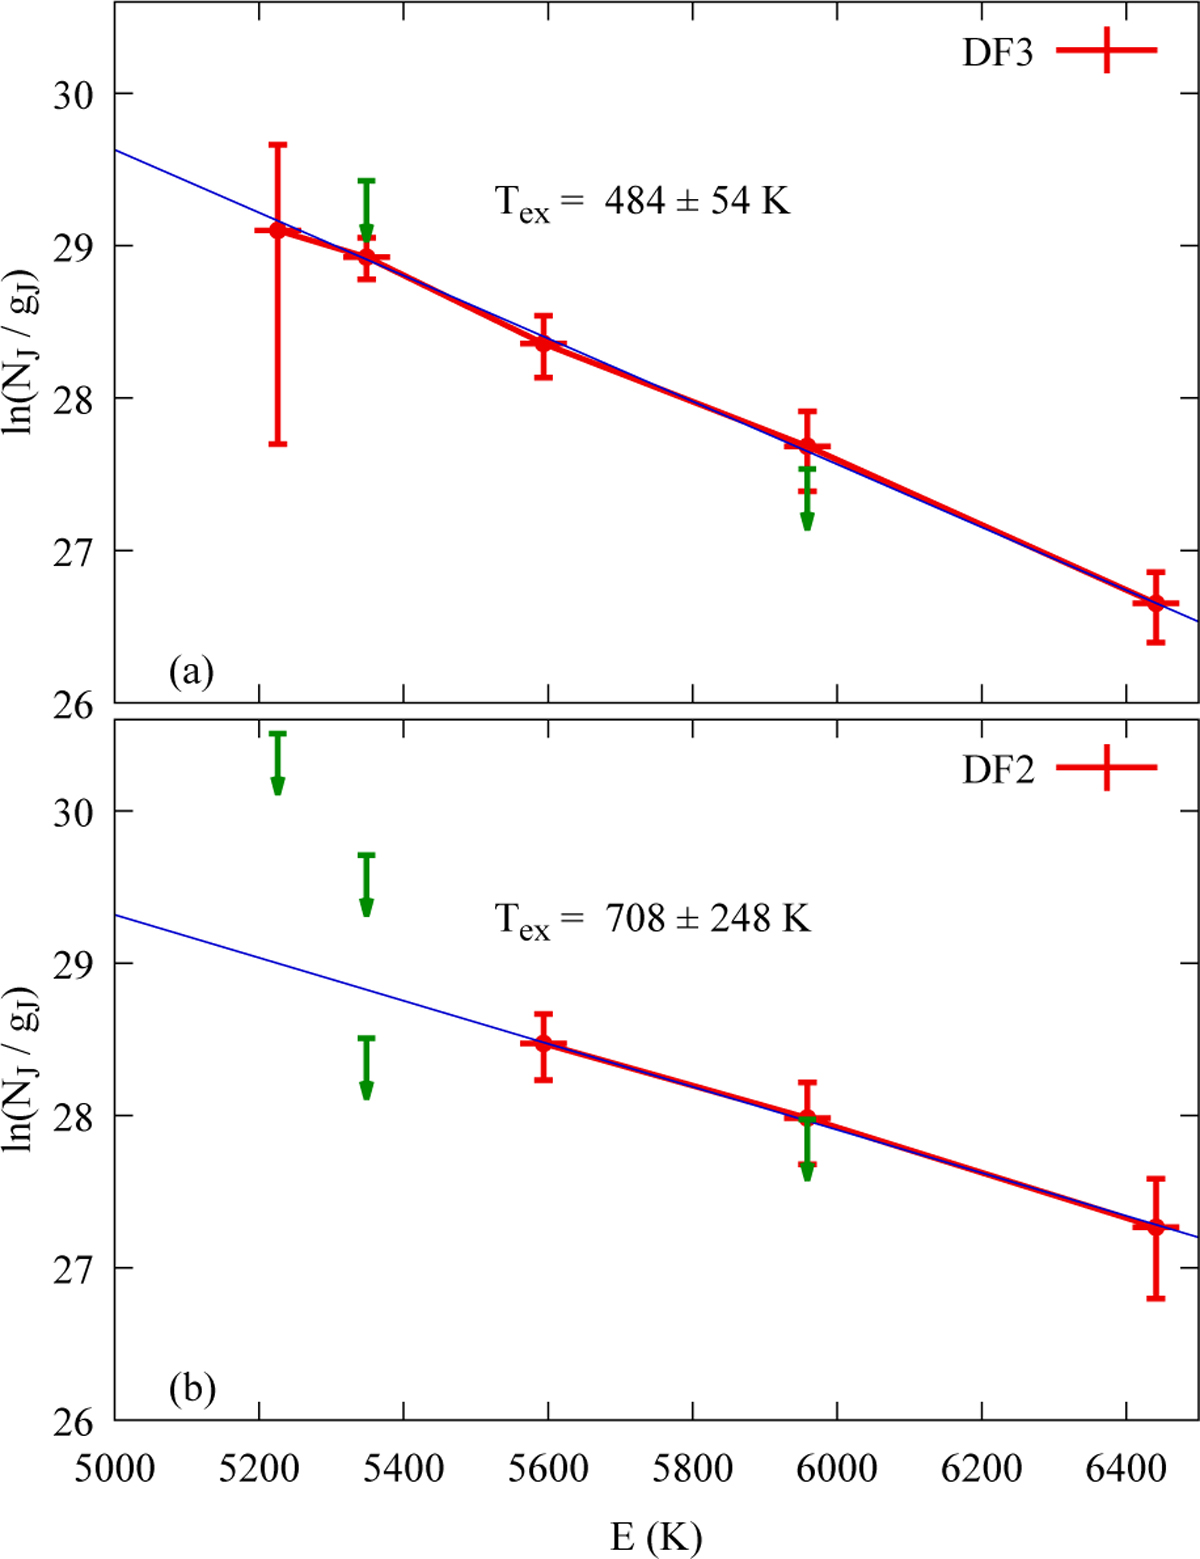
Excitation diagram of HD rovibrational lines in the DF3 (a) and the DF2 (b). The arrows correspond to the upper limits of HD lines which cannot be properly measured. The solid lines correspond to the fit to the distribution. The y-axis scales are identical to allow a visual comparison of Tex.
Current usage metrics show cumulative count of Article Views (full-text article views including HTML views, PDF and ePub downloads, according to the available data) and Abstracts Views on Vision4Press platform.
Data correspond to usage on the plateform after 2015. The current usage metrics is available 48-96 hours after online publication and is updated daily on week days.
Initial download of the metrics may take a while.