Fig. B.3
Download original image
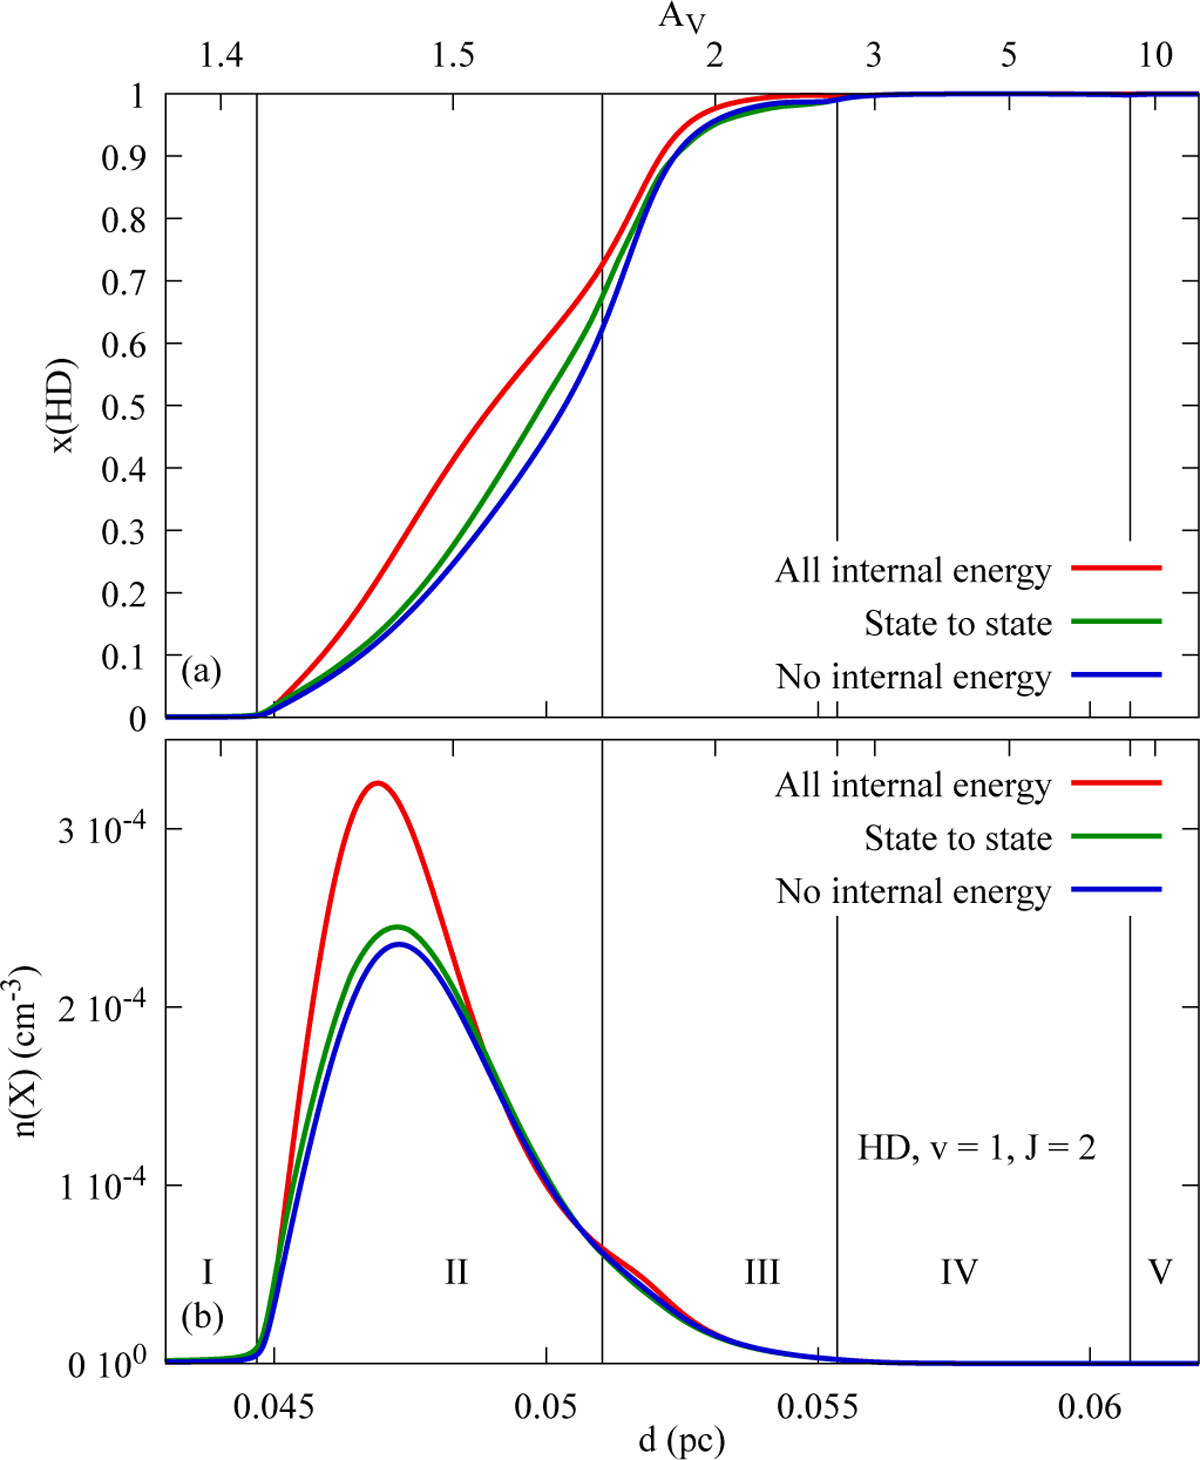
Comparison of HD abundance considering the different hypothesis (state-to-state, case (1) and case (2)). (a) Deuterium molecular fraction as a function of distance from the ionization front, d. The red line is for case (2), all internal energy used, the green line is for the state-to-state chemistry, and blue is for case (1) analytic expressions from Gay et al. (2011) using no internal energy. (b) Abundance of level v = 1 and J = 2.
Current usage metrics show cumulative count of Article Views (full-text article views including HTML views, PDF and ePub downloads, according to the available data) and Abstracts Views on Vision4Press platform.
Data correspond to usage on the plateform after 2015. The current usage metrics is available 48-96 hours after online publication and is updated daily on week days.
Initial download of the metrics may take a while.