Fig. 1
Download original image
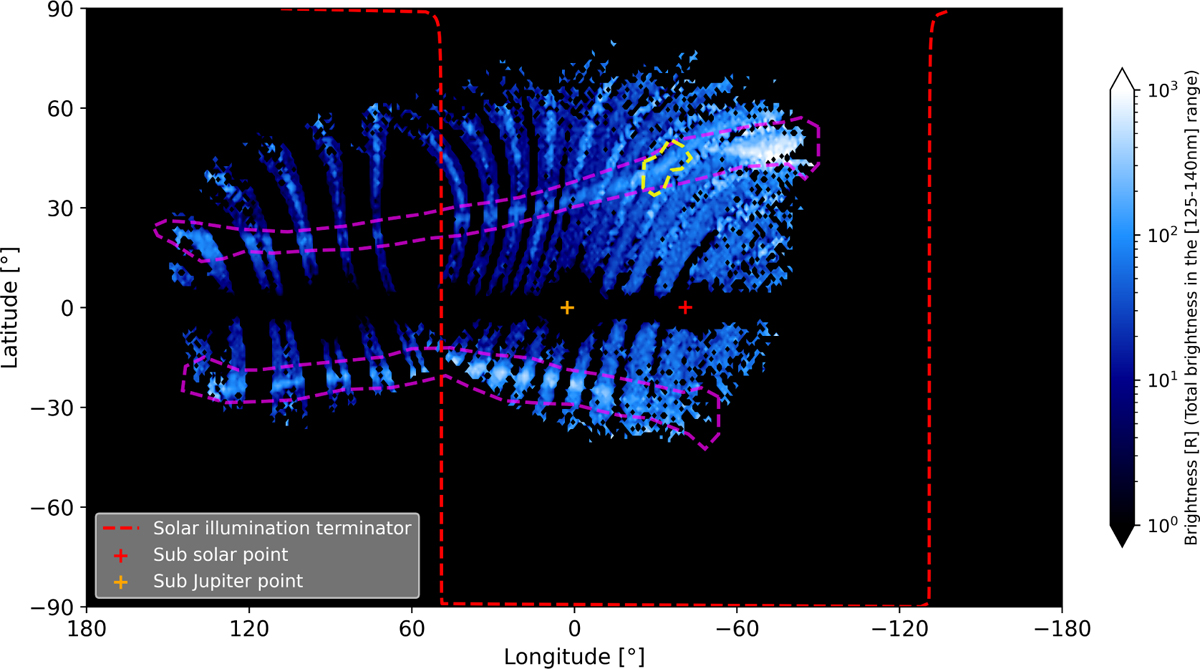
Integrated brightness map around the O I 130.4 nm and 135.6 nm auroral features derived from UVS measurements obtained during the Juno PJ34 flyby. The map includes photons collected with the wide and narrow slit of the UVS instrument. The magenta and dashed contours mark the main auroral regions revealed by these observations. The dashed yellow polygon marks a small manually selected region we only use to illustrate an example UVS spectrum in Fig. 2.
Current usage metrics show cumulative count of Article Views (full-text article views including HTML views, PDF and ePub downloads, according to the available data) and Abstracts Views on Vision4Press platform.
Data correspond to usage on the plateform after 2015. The current usage metrics is available 48-96 hours after online publication and is updated daily on week days.
Initial download of the metrics may take a while.