Fig. 2
Download original image
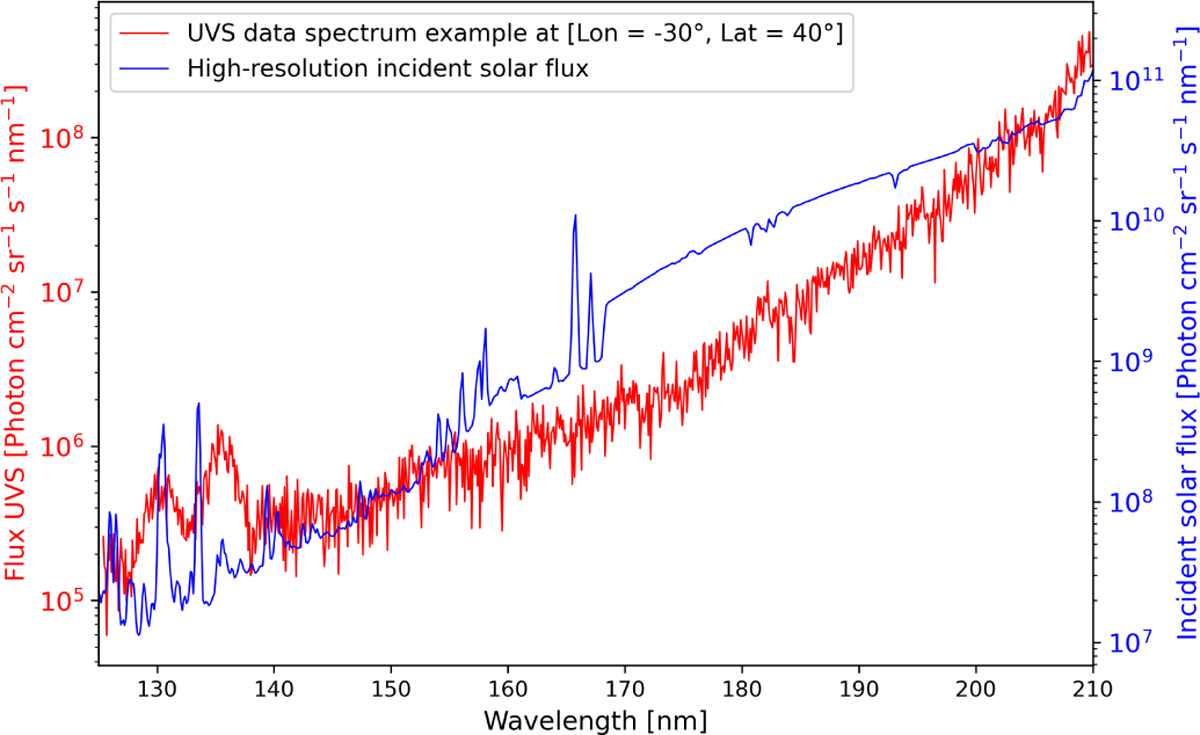
Example of a UVS spectrum showing the reflected solar continuum and the solar reference spectrum we used. The UVS spectrum (in red) was extracted from the spectral cube within the yellow polygon shown in Fig. 1, centered at longitude −30° and latitude 40°. The incident solar flux spectrum (in blue), originally measured at 1 AU and already representative of minimum solar activity (Curdt et al. 2001, 2004), was only rescaled to the heliocentric distance of ∼ 5.2 AU, corresponding to the separation of the Sun and Ganymede.
Current usage metrics show cumulative count of Article Views (full-text article views including HTML views, PDF and ePub downloads, according to the available data) and Abstracts Views on Vision4Press platform.
Data correspond to usage on the plateform after 2015. The current usage metrics is available 48-96 hours after online publication and is updated daily on week days.
Initial download of the metrics may take a while.