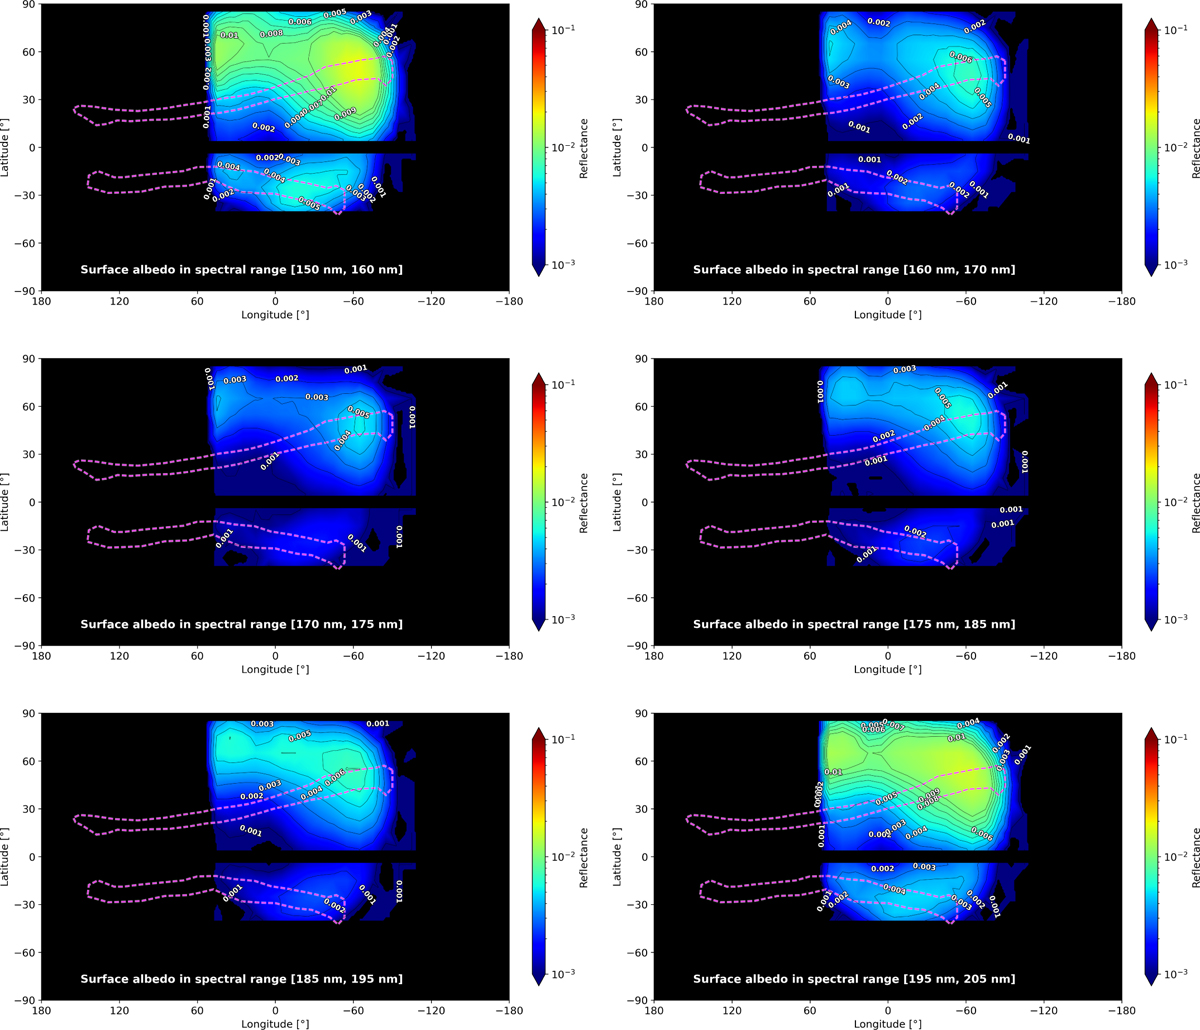
Fig. 4
Download original image
Surface reflectance maps of Ganymede in the following six spectral intervals: [150 nm, 160 nm], [160 nm, 170 nm], [170 nm, 175 nm], [175 nm, 185 nm],[185 nm, 195 nm], and [195 nm, 205 nm]. The reflectance was obtained by fitting the reflected solar continuum, using spectra extracted from the Juno/UVS spectral cube, spatially convolved with a latitude-longitude window of 10° × 10°. These maps complete the reflectance map in the [140 nm, 150 nm] interval shown in Fig. 3, and allow us to analyze the UV reflectance on the Ganymede surface spectrally and spatially.
Current usage metrics show cumulative count of Article Views (full-text article views including HTML views, PDF and ePub downloads, according to the available data) and Abstracts Views on Vision4Press platform.
Data correspond to usage on the plateform after 2015. The current usage metrics is available 48-96 hours after online publication and is updated daily on week days.
Initial download of the metrics may take a while.