Fig. 6
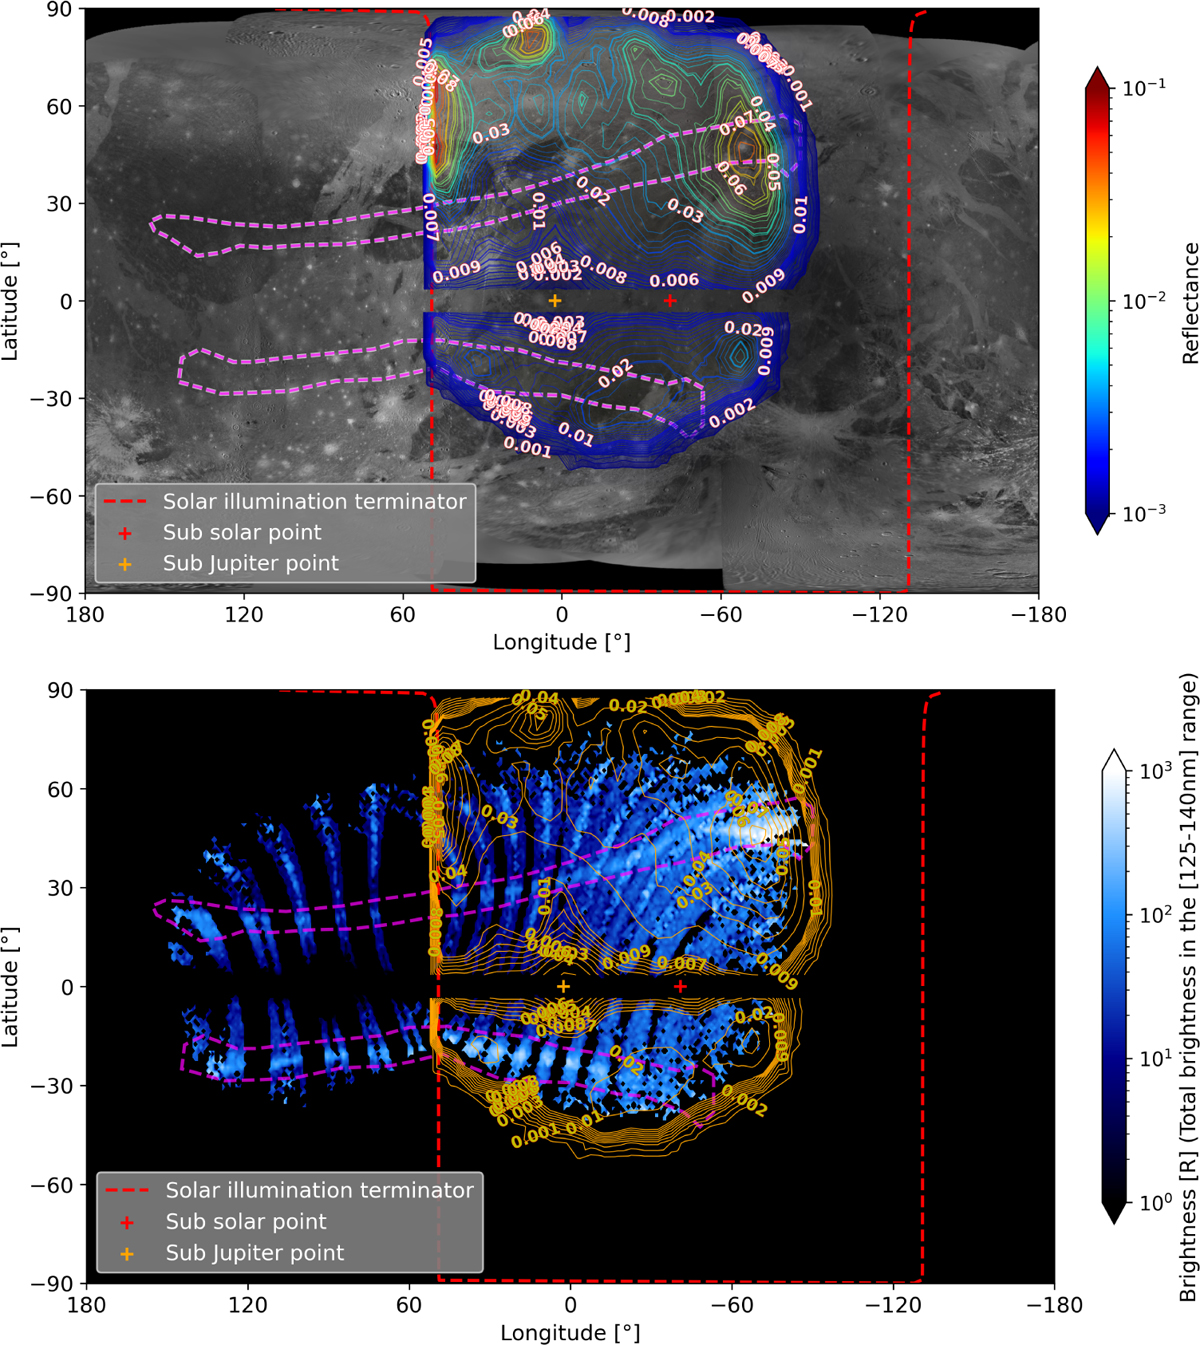
Download original image
Comparison of the surface reflectance map in the [140 nm, 150 nm] interval with two different datasets. Top: comparison with the visible surface map of Ganymede, highlighting geological features. Bottom: comparison with the total brightness map of the atomic oxygen auroral emission lines at 130.4 nm and 135.6 nm, observed during the Juno PJ34 flyby. The dashed magenta polygons indicate the main auroral regions identified from the UVS observations.
Current usage metrics show cumulative count of Article Views (full-text article views including HTML views, PDF and ePub downloads, according to the available data) and Abstracts Views on Vision4Press platform.
Data correspond to usage on the plateform after 2015. The current usage metrics is available 48-96 hours after online publication and is updated daily on week days.
Initial download of the metrics may take a while.