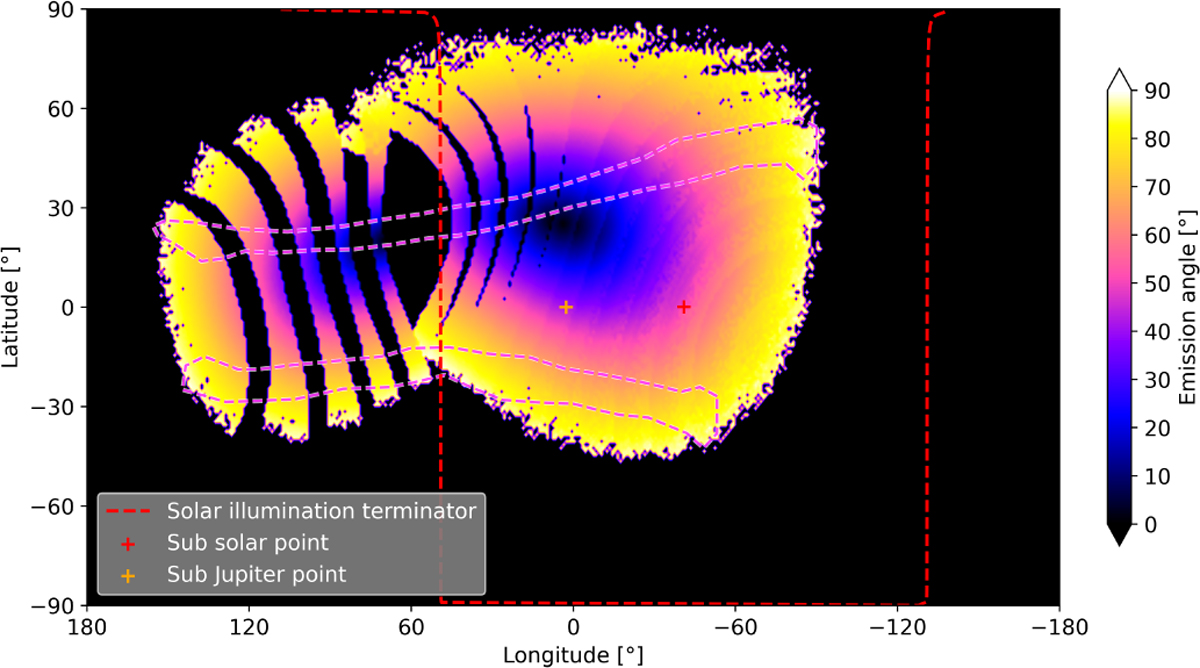
Fig. A.1
Download original image
Map of emission angles at Ganymede’s surface, defined as the angle between the local surface normal and the viewing direction of the UVS instrument. Low values (in blue) correspond to regions observed nearly perpendicularly to the surface, while high values (in yellow) indicate more oblique observations, which are less favorable for accurate surface albedo measurements.
Current usage metrics show cumulative count of Article Views (full-text article views including HTML views, PDF and ePub downloads, according to the available data) and Abstracts Views on Vision4Press platform.
Data correspond to usage on the plateform after 2015. The current usage metrics is available 48-96 hours after online publication and is updated daily on week days.
Initial download of the metrics may take a while.