Fig. A.2
Download original image
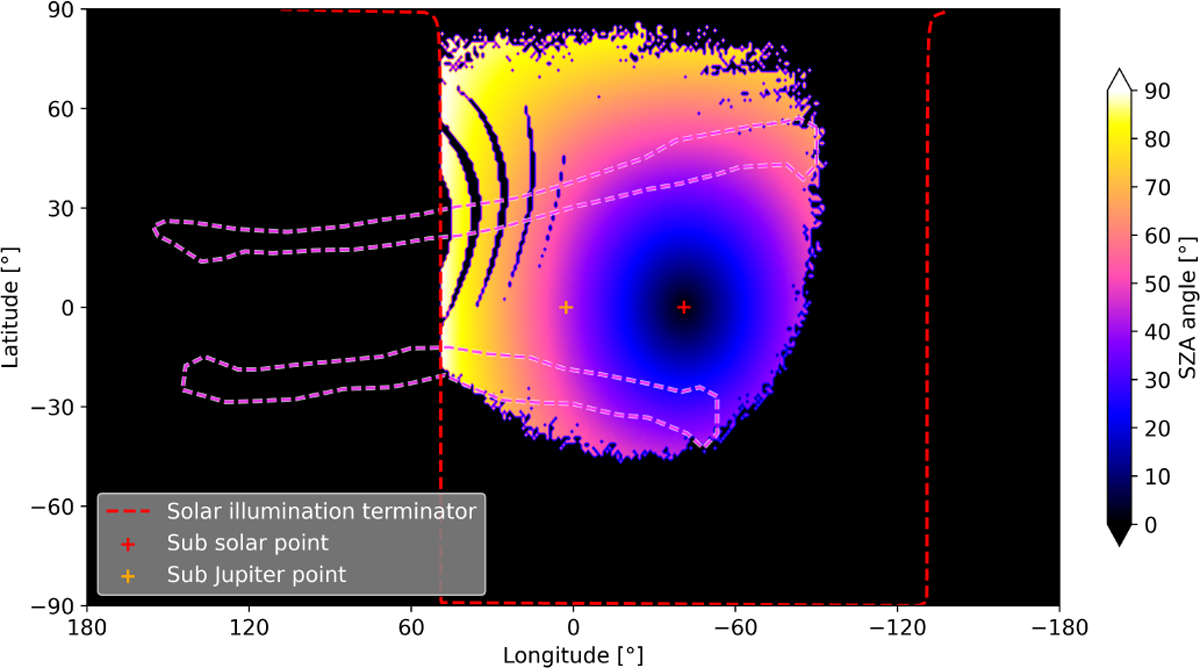
Map of the solar zenith angle at Ganymede’s surface, defined as the angle between the local surface normal and the direction of the Sun. Low values (in blue) indicate strongly illuminated regions near the solar zenith, while high values (in white) correspond to areas near the terminator, receiving weak or grazing solar illumination.
Current usage metrics show cumulative count of Article Views (full-text article views including HTML views, PDF and ePub downloads, according to the available data) and Abstracts Views on Vision4Press platform.
Data correspond to usage on the plateform after 2015. The current usage metrics is available 48-96 hours after online publication and is updated daily on week days.
Initial download of the metrics may take a while.