Fig. 3
Download original image
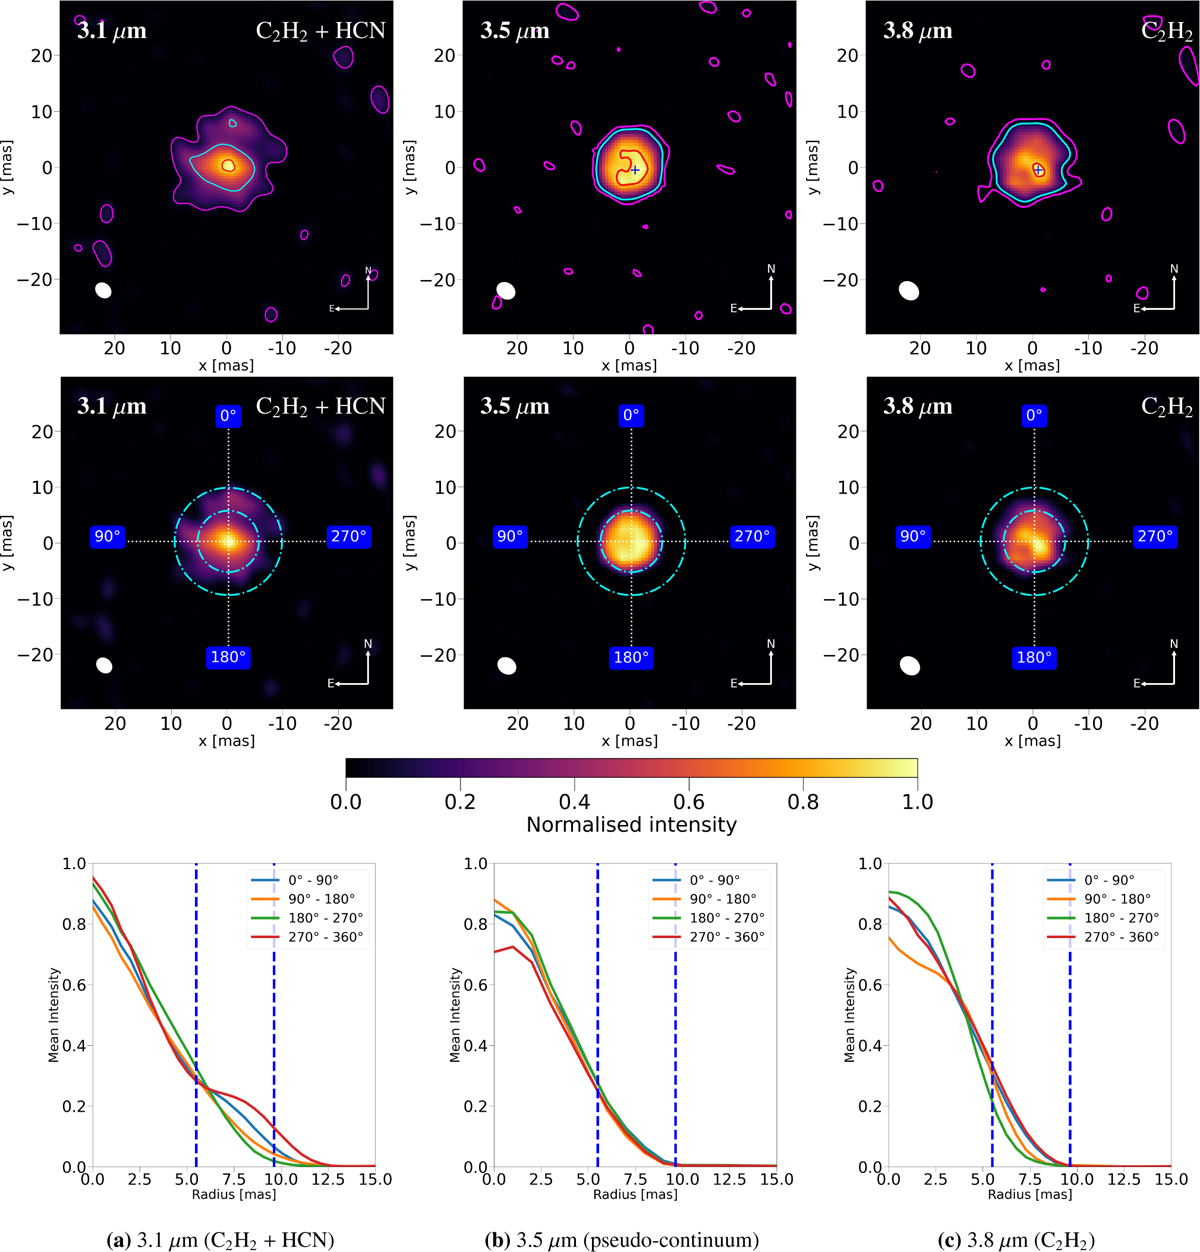
MiRA image reconstructions for the MATISSE L band for the 3.1 μm wavelength region (leftmost column), the 3.5 μm interval (middle), and the reconstructed data for the 3.8 μm region (right). In the top row, magenta (cyan) contours indicate where the signal is 5 times (30 times) above the estimated background noise, and the inner red contour encapsulates the regions where the S/N is in the top 10% of all values across the image. The blue cross indicates the position of the emission peak seen at 3.8 μm. In the middle row, the innermost dashed cyan circle represents the photospheric diameter of Paladini et al. (2017, see our Sect. 2), while the outer circle corresponds to the photospheric diameter scaled to 12 μm, based on the size ratio of the 2 and 12 μm mass-losing dynamic models in Paladini et al. (2009). Both are marked with a dashed blue line in the radial profile plots. The sectors marked by the dotted white lines show the regions used in the plotting of the radial profiles presented in the bottom row. The images were normalised with respect to the highest intensity pixel and re-centred by computing the local average intensity using a square kernel corresponding to 3 mas in radius. The white ellipse shows the estimated beam size and its inclination at each wavelength interval.
Current usage metrics show cumulative count of Article Views (full-text article views including HTML views, PDF and ePub downloads, according to the available data) and Abstracts Views on Vision4Press platform.
Data correspond to usage on the plateform after 2015. The current usage metrics is available 48-96 hours after online publication and is updated daily on week days.
Initial download of the metrics may take a while.