Open Access
Fig. 3
Download original image
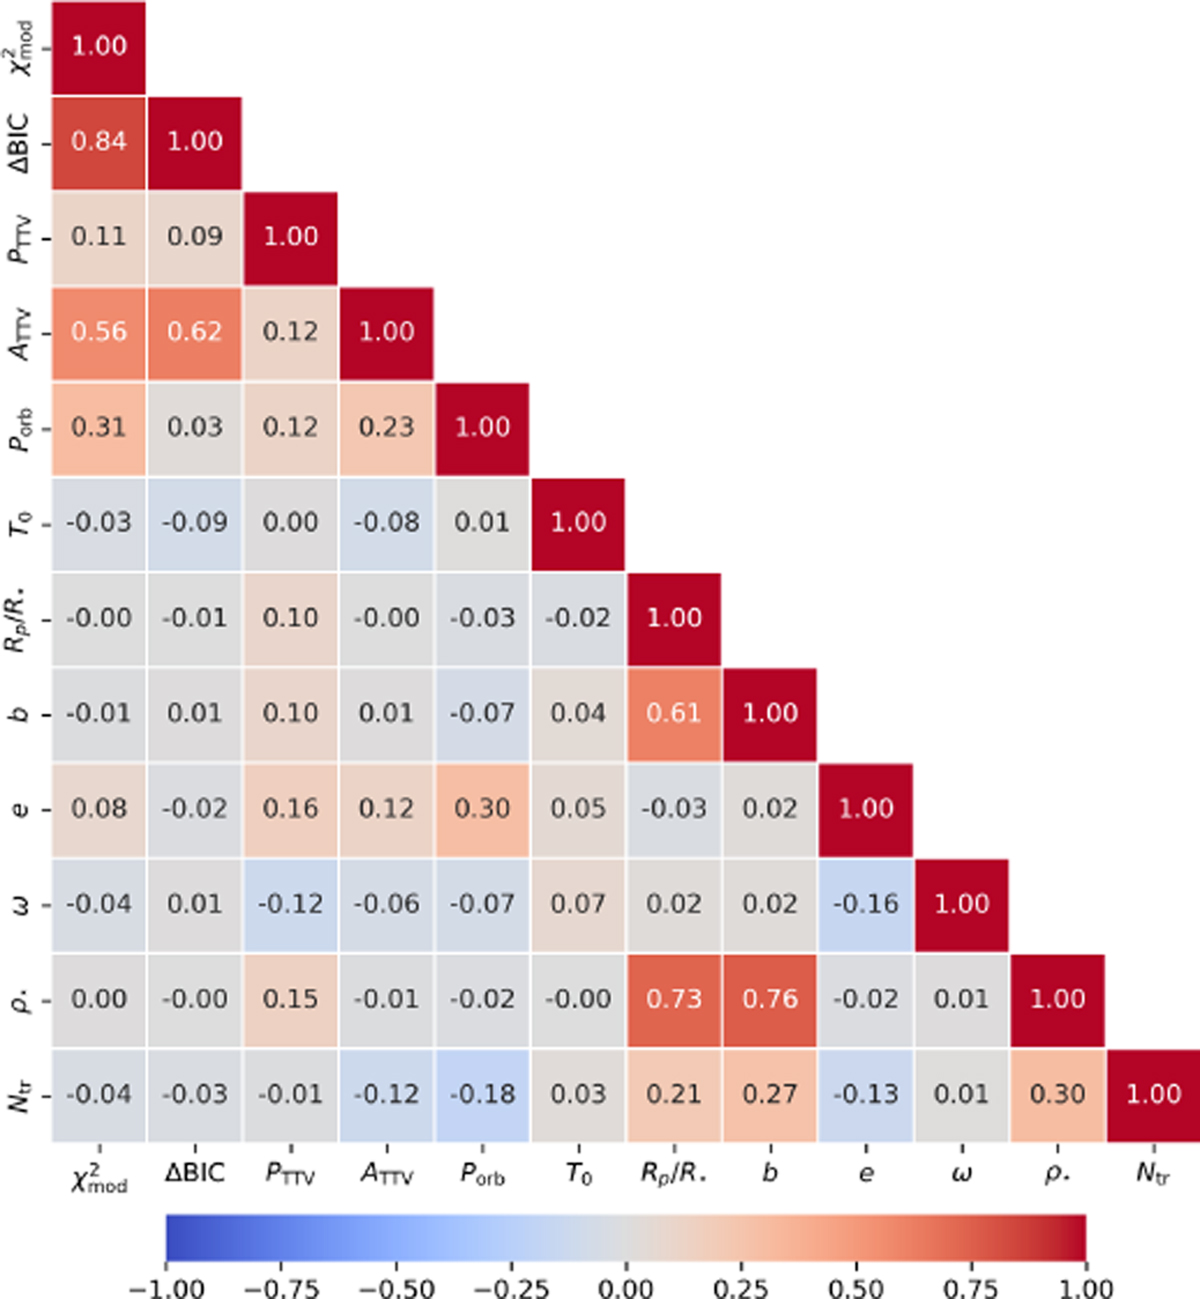
Pearson correlation map of parameters listed in Table A.1 for all our sample. The Pearson coefficient, r, quantifies the strength and direction of linear relationships between pairs of variables (r = 1 and r = −1 indicate perfect positive and negative correlations, while r = 0 indicates no correlation).
Current usage metrics show cumulative count of Article Views (full-text article views including HTML views, PDF and ePub downloads, according to the available data) and Abstracts Views on Vision4Press platform.
Data correspond to usage on the plateform after 2015. The current usage metrics is available 48-96 hours after online publication and is updated daily on week days.
Initial download of the metrics may take a while.