Fig. 3
Download original image
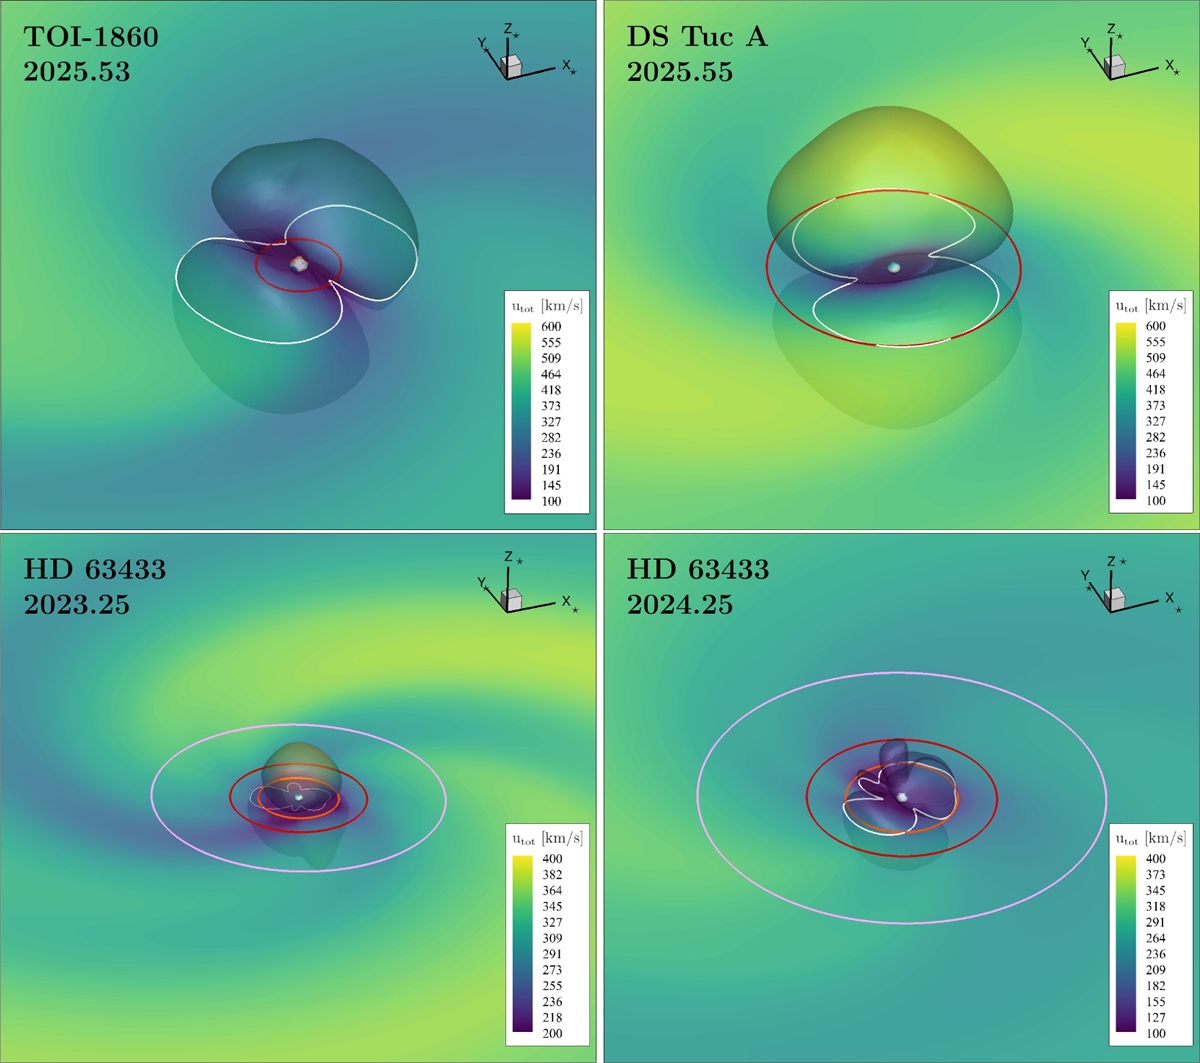
Simulated stellar wind of TOI-1860, DS Tuc A, and HD 63433 in the x⋆ − y⋆ plane. The rotation axis lies along the positive z⋆. The Alfvén surface is shown as a translucent surface and its intersection on the x⋆ − y⋆ plane is shown as a white curve. The colour bar indicates the total wind velocity. The orbits of the hosted exoplanets are also included as coloured ellipses. For HD 63433, we also show the simulations from the 2023 data analysed in Bellotti et al. (2024).
Current usage metrics show cumulative count of Article Views (full-text article views including HTML views, PDF and ePub downloads, according to the available data) and Abstracts Views on Vision4Press platform.
Data correspond to usage on the plateform after 2015. The current usage metrics is available 48-96 hours after online publication and is updated daily on week days.
Initial download of the metrics may take a while.