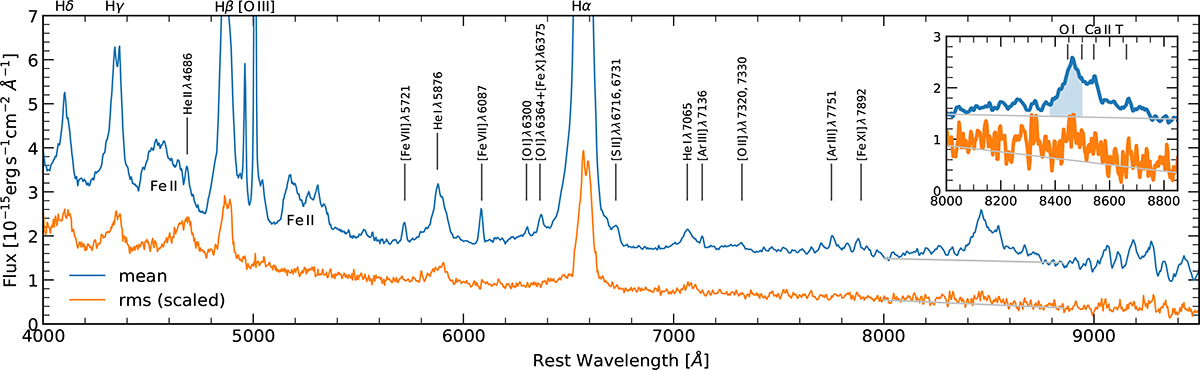
Fig. 1.
Download original image
Optical mean (blue) and rms (orange) spectra from the HST/STIS campaign. The rms spectrum is scaled (×5) and shifted in flux (−0.25 × 10⁻¹⁵ erg s−1 cm−2 Å−1) to highlight weak line features. The linear pseudo-continuum beneath the O Iλ8446 and the Ca II triplet complex is shown for orientation. The inset shows this spectral region in greater detail, with the rms spectrum scaled (×15) and shifted (−1.5 × 10⁻¹⁵ erg s−1 cm−2 Å−1). The O I λ8446 integration area is shaded in blue (see Sect. 3.2).
Current usage metrics show cumulative count of Article Views (full-text article views including HTML views, PDF and ePub downloads, according to the available data) and Abstracts Views on Vision4Press platform.
Data correspond to usage on the plateform after 2015. The current usage metrics is available 48-96 hours after online publication and is updated daily on week days.
Initial download of the metrics may take a while.