| Issue |
A&A
Volume 705, January 2026
|
|
|---|---|---|
| Article Number | L11 | |
| Number of page(s) | 5 | |
| Section | Letters to the Editor | |
| DOI | https://doi.org/10.1051/0004-6361/202557588 | |
| Published online | 12 January 2026 | |
Letter to the Editor
First reverberation mapping of a Bowen fluorescence line
1
Institut für Astrophysik und Geophysik, Universität Göttingen Friedrich-Hund-Platz 1 37077 Göttingen, Germany
2
Department of Physics and Astronomy, Wayne State University 666 W. Hancock Street Detroit MI 48201, USA
3
SUPA Physics and Astronomy, University of St. Andrews Fife KY16 9SS, United Kingdom
★ Corresponding author: This email address is being protected from spambots. You need JavaScript enabled to view it.
Received:
7
October
2025
Accepted:
17
December
2025
Abstract
Context. Reverberation mapping (RM) is a powerful tool to determine the extent, structure, and kinematics of the broad-line region (BLR) of active galactic nuclei (AGNs). So far, RM of the BLR has only been performed for recombination lines responding to the varying ionizing continuum.
Aims. We tested whether O I λ8446, attributed to Bowen fluorescence driven by Lyβ pumping, varied on short (day- to week-long) timescales during a 2016 Hubble Space Telescope/Space Telescope Imaging Spectrograph (HST/STIS) campaign of NGC 4593, and examined how it relates to other emission lines and the ionizing UV continuum.
Methods. We quantified the variability of O I λ8446 by its root-mean-square (rms) amplitude. We then extracted integrated light curves of O I λ8446 and other UV and optical emission lines, and compared them with each other and the UV continuum light curve using correlation analyses. In addition, we used archival near-infrared spectra to assess the dominant excitation mechanism of O I λ8446.
Results. We detect, for the first time, variability in O I λ8446 on day timescales. The fractional rms amplitude is ∼4% over the 4-week campaign. The O I λ8446 light curve reverberates with a delay of ∼2.5 days relative to Lyα, used as a proxy for Lyβ, detected at a false-alarm probability of 0.6% (significance of ∼2.8σ) under our adopted null hypothesis. It closely tracks Hα with only a minor additional delay of ∼0.3 days, placing its emission region at essentially the same distance as the Balmer-line weighted BLR. Line ratios indicate that Lyβ pumping is the dominant excitation mechanism for O I λ8446.
Conclusions. Our results establish O I λ8446 as the first Bowen fluorescence line to be reverberation-mapped, responding directly to variations in the Lyβ flux. We propose that in future campaigns targeting AGNs with larger BLRs, O I could enable dual-driver RM using both the continuum and the pumping line as drivers.
Key words: galaxies: active / galaxies: individual: NGC 4593 / galaxies: nuclei / quasars: emission lines / galaxies: Seyfert
© The Authors 2026
 Open Access article, published by EDP Sciences, under the terms of the Creative Commons Attribution License (https://creativecommons.org/licenses/by/4.0), which permits unrestricted use, distribution, and reproduction in any medium, provided the original work is properly cited.
This article is published in open access under the Subscribe to Open model. This email address is being protected from spambots. You need JavaScript enabled to view it. to support open access publication.
1. Introduction
Variability across all wavelength bands is a characteristic feature of active galactic nuclei (AGNs) and was already recognized in the earliest studies of these objects (Matthews & Sandage 1963; Fitch et al. 1967). It occurs in all spectral regions on timescales ranging from hours to weeks or even years (Ulrich et al. 1997) and has proven highly valuable for probing the inner structure of AGNs. In particular, the broad-line region (BLR) is traditionally studied through reverberation mapping (RM), which uses the delayed response of recombination emission lines to continuum variations to investigate the structure and kinematics of the emitting gas (Blandford & McKee 1982; Peterson 1993; Cackett et al. 2021). Usually, the bluest available continuum is used as a proxy for the ionizing continuum, which is assumed to drive the line variability.
Balmer lines have been extensively monitored in the past due to their accessibility in optical spectra for nearby AGNs, and have been used with great success to determine the size (Peterson et al. 1991; Kaspi et al. 2000; Grier et al. 2017) – and even the kinematics (Ulrich & Horne 1996; Kollatschny 2003; Bentz et al. 2009; Horne et al. 2021) – of the BLR1. However, much less attention has overall been given to other lines, high-ionization lines such as C IV λ1548 (e.g., Clavel et al. 1991; Goad et al. 2016; Grier et al. 2019) or low-ionization lines such as Mg II λ2800 (e.g., Shen et al. 2016; Czerny et al. 2019; Prince et al. 2023), mainly due to observational limitations. Other low-ionization lines, such as O I λ8446 or the Ca II triplet λλ8498, 8542, 8662, are entirely absent from RM campaigns, despite their strong diagnostic power for the physical conditions and excitation mechanisms in the BLR (e.g., Grandi 1980; Persson 1988; Ferland & Persson 1989; Joly 1989; Rodríguez-Ardila et al. 2002a; Matsuoka et al. 2007; Landt et al. 2008; Matsuoka et al. 2008; Marziani et al. 2013; Panda et al. 2020; Martínez-Aldama et al. 2021).
Among these lines, the O I λ8446 transition is of particular interest, as it can be enhanced through Bowen fluorescence driven by Lyβ pumping (Bowen 1947; Netzer & Penston 1976; Kwan & Krolik 1981). Recently, Bowen fluorescence lines have gained more attention in AGN studies following the detection of their variability in spectra of flaring AGNs (Trakhtenbrot et al. 2019; Makrygianni et al. 2023; Ochmann et al. 2024; Baldini et al. 2025; Śniegowska et al. 2025). However, dedicated short-term (days to weeks) monitoring campaigns targeting any Bowen fluorescence line are still absent. Here we present the first measurement of O I λ8446 variability and lag in NGC 4593 from a RM campaign with the Hubble Space Telescope/Space Telescope Imaging Spectrograph (HST/STIS), aiming to examine its relation to other emission lines and to the ionizing UV continuum.
2. Observations
For this study we utilized 26 HST/STIS observations of NGC 4593 obtained during 2016 July 12 and August 6 with nearly daily cadence. Analysis of the continuum reverberation lags obtained from the same HST data used here were presented in Cackett et al. (2018), where full details of the instrumental setup and data reduction are given. Analysis of the Swift data from the same campaign was presented in McHardy et al. (2018).
The original spectra presented in Cackett et al. (2018) are not corrected for small variations in the wavelength scale between observations. For the purpose of emission-line RM, we corrected these variations in each individual spectrum by performing minor wavelength shifts (< 1 Å) and scaling the [O III] λ5007 flux, which is assumed to be constant on timescales of years, to a common value of (106 ± 5)×10−15 erg s−1 cm−2, thereby minimizing the [O III] λ5007 residual in the root-mean-square (rms) spectrum. This procedure is standard in optical spectroscopic RM campaigns (e.g., van Groningen & Wanders 1992). The adjustments were applied only to the G430L and G750L parts of the spectra, as intercalibrations based on narrow lines are only reliable over a limited spectral range.
3. Results
3.1. The variability of O I λ8446
We calculated the mean and rms spectra from the 26 HST/STIS observations. Figure 1 shows the resulting mean and rms spectra, together with the interpolated linear pseudo-continuum beneath O I λ8446 used for further analysis. The rms spectrum is scaled and shifted for clarity. The most prominent lines in the spectra are indicated. The inset in the top right corner shows a zoom-in on the near-infrared O I and Ca II triplet complex. The rms spectrum reveals variability in O I λ8446 above the continuum level. To quantify this variability, we determined the fractional rms amplitude, Frms/Fmean, of the integrated O I λ8446 line flux within the wavelength range 8380–8498 Å. This interval includes most of the O I λ8446 flux, while limiting the potential contribution from Ca II λλ8498, 8542 to ≲20% (see Ochmann et al. 2025). With this definition, we find a fractional rms amplitude of ∼4%. This represents the first robust detection of day-scale, stochastic variability in O I λ8446 during a non-transient AGN monitoring campaign.
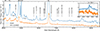 |
Fig. 1. Optical mean (blue) and rms (orange) spectra from the HST/STIS campaign. The rms spectrum is scaled (×5) and shifted in flux (−0.25 × 10⁻¹⁵ erg s−1 cm−2 Å−1) to highlight weak line features. The linear pseudo-continuum beneath the O Iλ8446 and the Ca II triplet complex is shown for orientation. The inset shows this spectral region in greater detail, with the rms spectrum scaled (×15) and shifted (−1.5 × 10⁻¹⁵ erg s−1 cm−2 Å−1). The O I λ8446 integration area is shaded in blue (see Sect. 3.2). |
3.2. The response of O I λ8446
To examine the expected connection between O I λ8446 and Lyβ pumping, we cross-correlated the O I light curve with those of Lyα, Hα, and the Swift UVW2 continuum (McHardy et al. 2018) using the interpolated cross-correlation function (ICCF; Gaskell & Peterson 1987). Since Lyβ lies outside the spectral range of the HST/STIS data, we used Lyα as a proxy, as both lines are expected to arise under similar physical conditions. The normalized light curves as well as the resulting CCFs are shown in Fig. 2. The time delay between light curves was determined from the centroid, τcent, of the upper 20% of the CCF. The error margins were estimated using the flux randomization and random subset selection (FR and RSS) method with 10 000 independent realizations (Peterson et al. 1998).
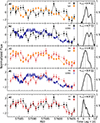 |
Fig. 2. Comparison of normalized light curves (left panels) of the emission lines O Iλ8446, Lyα, and Hα, together with the UVW2 continuum, with CCFs (right panels) of each pair, showing correlated variability and time delays between the individual emitting components. The CCFs are plotted between 0 and 1. The dashed line indicates τcent. |
Overall, we find that the line and continuum light curves are similar in shape but shifted relative to each other. All correlations are strong, with rmax ∼ 0.75 − 0.80, except for O I versus UVW2, where we find a lower value of rmax ∼ 0.60. O I λ8446 lags Lyα and the UVW2 continuum by  and
and  days, respectively (Figs. 2a,b). In comparison, Hα lags Lyα and the UVW2 continuum by
  and
and  days, respectively, corresponding to time lags shorter by about 0.5–1 days, although the differences are not significant within the 1σ uncertainties (Figs. 2c,d). When comparing the light curves of O I λ8446 and Hα directly, we find good agreement overall, with a tendency for O I to vary later than Hα by ∼0.3 days (Fig. 2e). To test the significance of the O I lags, we performed a Monte-Carlo permutation test in which we randomly permuted the O I fluxes among the observed epochs under the null hypothesis of no correlation (see Appendix A for details). This test yields a false-alarm probability of ∼0.6% (significance of ∼2.8σ) for the O I–Lyα pair, and a false-alarm probability of ∼11.6% (significance of ∼1.6σ) for the O I–UVW2 pair, consistent with a substantially weaker and less robust correlation in the latter case.
4. Discussion
4.1. The excitation mechanism and origin of variability
Recombination, collisional excitation, continuum fluorescence, and Bowen fluorescence driven by Lyβ pumping are all possible excitation mechanisms of O I λ8446 (see Grandi 1980). To identify the dominant mechanism in NGC 4593, we examined the presence of other permitted O I emission lines in the mean HST/STIS spectrum. We also analyzed near-infrared SpeX and MUSE spectra of NGC 4593 from 2006 and 2019 presented by Landt et al. (2008) and Ochmann et al. (2025), respectively2.
We exclude recombination as a significant contributor to the production of O I based on the absence of detectable quintet lines with comparable strength to that of O I λ8446 (see Grandi 1975). In particular, recombination would imply a relative strength of λ7774/λ8446 ≈ 1.1 − 1.7 (Grandi 1980; Landt et al. 2008). We derive an upper limit of λ7774/λ8446 = 0.2 from the MUSE spectrum, and this value is only reached if the line previously identified as He I λ7816 is almost fully attributed to the right peak of a double-peaked O I λ7774. While the ratio of λ7774/λ8446 ≤ 0.2 could imply the presence of collisional excitation for which a ratio of ≈0.3 is expected (Grandi 1980), continuum fluorescence can be excluded by the complete absence of O I λ13165 in the SpeX spectrum (see Grandi 1975, 1980). To test the presence of Lyβ pumping, we calculated the photon ratio n(λ11287)/n(λ8446) after decomposition of the O I and Ca II triplet complex following the procedure described by Ochmann et al. (2025) and using the same Ca II λ8662 template. We find a photon ratio of ∼0.8, close to unity as would be the case for Lyβ as the sole excitation mechanism (e.g., Rudy et al. 1989). We conclude that Lyβ is indeed the dominant excitation mechanism3, and the discrepancy from unity can be explained by a secondary contribution from collisional excitation, similarly to what was found for other sources (Rodríguez-Ardila et al. 2002a; Matsuoka et al. 2007; Landt et al. 2008; Tripodi et al. 2025). Based on our line diagnostics, we suggest that Lyβ pumping is the driver of the detected day-scale variability in O I λ8446; that is, the variability of O I λ8446 is caused by variability in the incident Lyβ flux.
4.2. The emission region
From the cross-correlation analysis in Sect. 3.2, we obtain an Hα-weighted BLR radius of  light-days in NGC 4593, based on the lag relative to UVW2. This value is in excellent agreement with BLR radii of this source determined in earlier studies (Dietrich et al. 1994; Kollatschny & Dietrich 1997; Denney et al. 2006; Williams et al. 2018). In comparison to Hα, O I λ8446 has a slightly higher delay of
  days relative to the UVW2 continuum, consistent within the uncertainties4. At first glance, this agrees with studies indicating that O I, together with Fe II and Ca II, is emitted at larger radii than the hydrogen lines (e.g., Persson 1988; Rodríguez-Ardila et al. 2002b; Marinello et al. 2016), based on the typically larger widths of the hydrogen lines in some objects, in particular in Pop. B sources (Martínez-Aldama et al. 2015, 2021). However, we argue that the delays relative to UVW2 should not be compared directly, since we identified Bowen fluorescence driven by Lyβ pumping as the primary excitation mechanism of O I in NGC 4593. Accordingly, the driving light curve of O I is Lyα as a proxy for Lyβ, and the distance to the ionizing source – assuming a planar BLR geometry, as is supported by the double-peaked broad emission lines in NGC 4593 (Ochmann et al. 2025) – corresponds to the delay of Lyα relative to UVW2 plus the delay of O I relative to Lyα. For the delay of Lyα relative to UVW2, we obtain
  days. The distance of the O I region from the continuum source is therefore ∼3.5 days. This corresponds to the distance of the Hα region from the continuum source as established in Sect. 3.2.
We find a very good correlation (rmax ∼ 0.80) between the Hα and O I λ8446 light curves (see Fig. 2e), with only a minor time shift of ∼0.3 days. This supports the conclusion that, within the uncertainties, both lines in NGC 4593 are emitted at essentially the same distance from the continuum source. A detailed study of emission-line profiles in this galaxy by Ochmann et al. (2025) revealed double-peaked structures in both Hβ and O I λ8446, with Hβ broader by ∼25% compared to O I λ8446 (4500 km s−1 vs. 3580 km s−1; see also Marinello et al. 2016). Notably, the red peak of Hβ is shifted toward lower velocities by ∼200 km s−1. If the line widths are governed primarily by virial motions, as is often assumed in profile comparison studies of O I/Ca II and Hβ/Hα, this broadening and peak shift cannot be explained by placing the Balmer phase of the BLR closer to the ionizing source within the same disk-like configuration, as this would naturally result in larger peak separations. We instead propose an explanation involving a vertically stratified, disk-like BLR with scale-height-dependent turbulence (Goad et al. 2012; Kollatschny & Zetzl 2013a,b), in which the different broad emission lines arise in distinct layers parallel to the disk plane. A similar configuration – a plane-parallel distribution of emitting gas above and below the disk – was already discussed by Martínez-Aldama et al. (2015) in the context of O I, Ca II, and Hβ, and was invoked by Ochmann et al. (2024) to explain the differing profile widths and shapes of these lines in NGC 1566.
We note that the detection of Lyβ/Lyα as variability drivers in AGN emission lines, together with the proposed vertically stratified BLR structure, could be exploited in future campaigns to perform dual-driver RM. For the small BLR size in NGC 4593, differential light-travel time delays between the cascaded responses are too short to be resolved even with daily cadence. In other words, we cannot separate the delay chain from the continuum through Lyα to O I from that of the continuum to Hα, or the relative delay between Hα and O I. In sources with much larger BLRs, however, such delays may become accessible, provided that the different excitation channels operate on spatial scales comparable to the observational cadence.
5. Conclusions
In this study, we present the first RM analysis of a Bowen fluorescence line, O I λ8446, based on an HST/STIS monitoring campaign of NGC 4593. We quantified the variability of O I λ8446, examined its relation to other emission lines and to the ionizing UV continuum, and determined the dominant excitation mechanism. Our main results are as follows:
-
We detect, for the first time, short-term (day-scale) variability in O I λ8446 during a non-transient AGN monitoring campaign, with a fractional rms amplitude of ∼4%. Line diagnostics show that Lyβ pumping is the dominant excitation mechanism.
-
The O I λ8446 light curve reverberates with a delay of ∼2.5 days relative to Lyα, used here as a proxy for Lyβ, detected at a false-alarm probability of 0.6% (significance of ∼2.8σ) under our adopted null hypothesis. It closely tracks Hα with only a minor additional delay (∼0.3 days), placing its emission region at essentially the same distance as the Balmer-line weighted BLR.
Our results establish O I λ8446 as the first Bowen fluorescence line to be reverberation-mapped, responding directly to variations in Lyβ flux. We propose that in future campaigns targeting AGNs with larger BLRs, O I could enable dual-driver RM using both the continuum and the pumping line as drivers, offering a new way to probe the structure of the BLR.
Acknowledgments
The authors thank the anonymous referee for helpful comments that strengthened the paper. MWO acknowledges the support of the German Aerospace Center (DLR) within the framework of the “Verbundforschung Astronomie und Astrophysik” through grant 50OR2305 with funds from the BMWK. EMC gratefully acknowledges support for program number 14121 provided by NASA through a grant from the Space Telescope Science Institute, which is operated by the Association of Universities for Research in Astronomy, Incorporated, under NASA contract NAS5-26555. MAP and WK greatly acknowledge support by the DFG grants KO 857/35-1 and KO 857/35-2.
References
- Baldini, P., Rau, A., Arcodia, R., et al. 2025, A&A, 701, A224 [NASA ADS] [CrossRef] [EDP Sciences] [Google Scholar]
- Barth, A. J., Bennert, V. N., Canalizo, G., et al. 2015, ApJS, 217, 26 [NASA ADS] [CrossRef] [Google Scholar]
- Bentz, M. C., Walsh, J. L., Barth, A. J., et al. 2009, ApJ, 705, 199 [NASA ADS] [CrossRef] [Google Scholar]
- Blandford, R. D., & McKee, C. F. 1982, ApJ, 255, 419 [Google Scholar]
- Bowen, I. S. 1947, PASP, 59, 196 [NASA ADS] [CrossRef] [Google Scholar]
- Cackett, E. M., Chiang, C.-Y., McHardy, I., et al. 2018, ApJ, 857, 53 [NASA ADS] [CrossRef] [Google Scholar]
- Cackett, E. M., Bentz, M. C., & Kara, E. 2021, iScience, 24, 102557 [NASA ADS] [CrossRef] [Google Scholar]
- Clavel, J., Reichert, G. A., Alloin, D., et al. 1991, ApJ, 366, 64 [NASA ADS] [CrossRef] [Google Scholar]
- Czerny, B., Olejak, A., Rałowski, M., et al. 2019, ApJ, 880, 46 [Google Scholar]
- Denney, K. D., Bentz, M. C., Peterson, B. M., et al. 2006, ApJ, 653, 152 [NASA ADS] [CrossRef] [Google Scholar]
- Dietrich, M., Kollatschny, W., Alloin, D., et al. 1994, A&A, 284, 33 [NASA ADS] [Google Scholar]
- Fausnaugh, M. M., Denney, K. D., Barth, A. J., et al. 2016, ApJ, 821, 56 [Google Scholar]
- Ferland, G. J., & Persson, S. E. 1989, ApJ, 347, 656 [NASA ADS] [CrossRef] [Google Scholar]
- Fitch, W. S., Pacholczyk, A. G., & Weymann, R. J. 1967, ApJ, 150, L67 [NASA ADS] [CrossRef] [Google Scholar]
- Gaskell, C. M., & Peterson, B. M. 1987, ApJS, 65, 1 [NASA ADS] [CrossRef] [Google Scholar]
- Goad, M. R., Korista, K. T., & Ruff, A. J. 2012, MNRAS, 426, 3086 [Google Scholar]
- Goad, M. R., Korista, K. T., De Rosa, G., et al. 2016, ApJ, 824, 11 [NASA ADS] [CrossRef] [Google Scholar]
- Grandi, S. A. 1975, ApJ, 196, 465 [NASA ADS] [CrossRef] [Google Scholar]
- Grandi, S. A. 1980, ApJ, 238, 10 [NASA ADS] [CrossRef] [Google Scholar]
- Grandi, S. A. 1983, ApJ, 268, 591 [Google Scholar]
- Grier, C. J., Trump, J. R., Shen, Y., et al. 2017, ApJ, 851, 21 [NASA ADS] [CrossRef] [Google Scholar]
- Grier, C. J., Shen, Y., Horne, K., et al. 2019, ApJ, 887, 38 [NASA ADS] [CrossRef] [Google Scholar]
- Horne, K., De Rosa, G., Peterson, B. M., et al. 2021, ApJ, 907, 76 [Google Scholar]
- Joly, M. 1989, A&A, 208, 47 [NASA ADS] [Google Scholar]
- Kaspi, S., Smith, P. S., Netzer, H., et al. 2000, ApJ, 533, 631 [Google Scholar]
- Kollatschny, W. 2003, A&A, 407, 461 [CrossRef] [EDP Sciences] [Google Scholar]
- Kollatschny, W., & Dietrich, M. 1997, A&A, 323, 5 [NASA ADS] [Google Scholar]
- Kollatschny, W., & Zetzl, M. 2013a, A&A, 549, A100 [NASA ADS] [CrossRef] [EDP Sciences] [Google Scholar]
- Kollatschny, W., & Zetzl, M. 2013b, A&A, 558, A26 [NASA ADS] [CrossRef] [EDP Sciences] [Google Scholar]
- Koshida, S., Minezaki, T., Yoshii, Y., et al. 2014, ApJ, 788, 159 [Google Scholar]
- Kwan, J., & Krolik, J. H. 1981, ApJ, 250, 478 [NASA ADS] [CrossRef] [Google Scholar]
- Landt, H., Bentz, M. C., Ward, M. J., et al. 2008, ApJS, 174, 282 [NASA ADS] [CrossRef] [Google Scholar]
- Makrygianni, L., Trakhtenbrot, B., Arcavi, I., et al. 2023, ApJ, 953, 32 [NASA ADS] [CrossRef] [Google Scholar]
- Marinello, M., Rodríguez-Ardila, A., Garcia-Rissmann, A., Sigut, T. A. A., & Pradhan, A. K. 2016, ApJ, 820, 116 [Google Scholar]
- Martínez-Aldama, M. L., Dultzin, D., Marziani, P., et al. 2015, ApJS, 217, 3 [CrossRef] [Google Scholar]
- Martínez-Aldama, M. L., Panda, S., Czerny, B., et al. 2021, ApJ, 918, 29 [CrossRef] [Google Scholar]
- Marziani, P., Martínez-Aldama, M. L., Dultzin, D., & Sulentic, J. W. 2013, Astron. Rev., 8, 26 [Google Scholar]
- Matsuoka, Y., Oyabu, S., Tsuzuki, Y., & Kawara, K. 2007, ApJ, 663, 781 [NASA ADS] [CrossRef] [Google Scholar]
- Matsuoka, Y., Kawara, K., & Oyabu, S. 2008, ApJ, 673, 62 [NASA ADS] [CrossRef] [Google Scholar]
- Matthews, T. A., & Sandage, A. R. 1963, ApJ, 138, 30 [CrossRef] [Google Scholar]
- McHardy, I. M., Connolly, S. D., Horne, K., et al. 2018, MNRAS, 480, 2881 [NASA ADS] [CrossRef] [Google Scholar]
- Netzer, H., & Penston, M. V. 1976, MNRAS, 174, 319 [Google Scholar]
- Ochmann, M. W., Kollatschny, W., Probst, M. A., et al. 2024, A&A, 686, A17 [NASA ADS] [CrossRef] [EDP Sciences] [Google Scholar]
- Ochmann, M. W., Weilbacher, P. M., Probst, M. A., et al. 2025, A&A, 697, L5 [NASA ADS] [CrossRef] [EDP Sciences] [Google Scholar]
- Oknyanskii, V. L., Lyutyi, V. M., & Chuvaev, K. K. 1991, Soviet. Astron. Lett., 17, 100 [Google Scholar]
- Panda, S., Martínez-Aldama, M. L., Marinello, M., et al. 2020, ApJ, 902, 76 [NASA ADS] [CrossRef] [Google Scholar]
- Persson, S. E. 1988, ApJ, 330, 751 [NASA ADS] [CrossRef] [Google Scholar]
- Peterson, B. M. 1993, PASP, 105, 247 [NASA ADS] [CrossRef] [Google Scholar]
- Peterson, B. M., Balonek, T. J., Barker, E. S., et al. 1991, ApJ, 368, 119 [NASA ADS] [CrossRef] [Google Scholar]
- Peterson, B. M., Wanders, I., Horne, K., et al. 1998, PASP, 110, 660 [Google Scholar]
- Prince, R., Zajaček, M., Panda, S., et al. 2023, A&A, 678, A189 [NASA ADS] [CrossRef] [EDP Sciences] [Google Scholar]
- Rodríguez-Ardila, A., Viegas, S. M., Pastoriza, M. G., Prato, L., & Donzelli, C. J. 2002a, ApJ, 572, 94 [CrossRef] [Google Scholar]
- Rodríguez-Ardila, A., Viegas, S. M., Pastoriza, M. G., & Prato, L. 2002b, ApJ, 565, 140 [CrossRef] [Google Scholar]
- Rudy, R. J., Rossano, G. S., & Puetter, R. C. 1989, ApJ, 342, 235 [Google Scholar]
- Shen, Y., Horne, K., Grier, C. J., et al. 2016, ApJ, 818, 30 [NASA ADS] [CrossRef] [Google Scholar]
- Śniegowska, M., Trakhtenbrot, B., Makrygianni, L., et al. 2025, ApJ, 989, 173 [Google Scholar]
- Trakhtenbrot, B., Arcavi, I., Ricci, C., et al. 2019, Nat. Astron., 3, 242 [Google Scholar]
- Tripodi, R., Bradač, M., D’Eugenio, F., et al. 2025, ApJ, 994, L6 [Google Scholar]
- Ulrich, M.-H., & Horne, K. 1996, MNRAS, 283, 748 [NASA ADS] [CrossRef] [Google Scholar]
- Ulrich, M.-H., Maraschi, L., & Urry, C. M. 1997, ARA&A, 35, 445 [NASA ADS] [CrossRef] [Google Scholar]
- van Groningen, E., & Wanders, I. 1992, PASP, 104, 700 [NASA ADS] [CrossRef] [Google Scholar]
- Williams, P. R., Pancoast, A., Treu, T., et al. 2018, ApJ, 866, 75 [NASA ADS] [CrossRef] [Google Scholar]
- Yin, C., Lawrence, A., Ward, M., Homan, D., & Kollatschny, W. 2025, MNRAS, 540, 3032 [Google Scholar]
We note that RM has been applied not only to the BLR, but also to the accretion disk (e.g., Fausnaugh et al. 2016; Cackett et al. 2018), the dusty torus (e.g., Koshida et al. 2014), and the coronal line region (e.g., Oknyanskii et al. 1991; Yin et al. 2025).
We consider it justified to use spectra from epochs separated by several years for line diagnostics, as the spectra of NGC 4593 over the past 20 years show only typical variability, with no evidence for fundamental changes in the continuum flux driving the broad-line emission (see Denney et al. 2006; Landt et al. 2008; Barth et al. 2015; Cackett et al. 2018; Ochmann et al. 2025).
We also calculated the photon ratio n(λ1304)/n(λ8446) from the HST/STIS spectrum and obtain only ∼0.1, well below the expected one-to-one relation. This discrepancy may arise from absorption features near O I λ1304, possible reddening, and destruction mechanisms that can deplete O I λ1304 photons (see Kwan & Krolik 1981; Grandi 1983), effectively breaking the expected relation. No reverberating signal in O I λ1304 is found.
We note that the correlation between O I and UVW2 is weaker (rmax ∼ 0.60 vs. ∼0.80 for Hα), and the CCF peak is less well defined, providing additional indication that the continuum is not the true driver of O I but that the correlation rather reflects the general similarity of all light curves.
Appendix A: Significance of the O I lag detection
To assess the significance of the O I λ8446 lag detections with respect to Lyα and the UVW2 light curve, we calculated the false alarm probability (FAP), that is, the likelihood that the correlation coefficients rmax reported in Sect. 3.2 arise from random, uncorrelated light curves. To this end, we created 10 000 surrogate light curves of O I λ8446 and Hα under the null hypothesis of no correlation. In each realization, we randomly permuted the O I λ8446 and Hα fluxes among the observed epochs and added Gaussian perturbations according to the measurement uncertainties, thereby preserving the flux distribution, sampling pattern, and uncertainty properties, while destroying any physical correlation with Lyα and UVW2, respectively. At the same time, we keep the Lyα and UVW2 light curves fixed, thereby preserving the observed red-noise variability of the driving light curves. For each realization, we then recorded  of the ICCF, and the FAP was calculated from the number of realizations for which
  . The distributions of
  for each light-curve pair are shown in Fig. A.1.
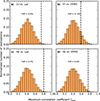 |
Fig. A.1. Distribution of |

The surrogate  distributions for all four line–driver combinations are very similar in shape and are mainly determined by the sampling pattern and lag range. For the pairs O I–Lyα, Hα–Lyα, and Hα–UVW2 we obtain FAP(O I–Lyα) = 0.6%, FAP(Hα–Lyα) = 0.2%, and FAP(Hα–UVW2) = 0.6%, indicating that in these three cases the correlations are detected at > 99% confidence and are unlikely to arise from uncorrelated light curves. For the O I λ8446–UVW2 pair we find FAP(O I–UVW2) = 11.6%, implying that the corresponding correlation is substantially less significant than for the other pairs and that the O I-UVW2 lag should be regarded as comparatively weak and less robust.
We note that the null test preserves the observed flux distribution, sampling, and measurement uncertainties, but does not model the red-noise variability of the line light curves. Given the short baseline and modest variability, more sophisticated models (e.g., a damped random walk) are poorly constrained and thus not pursued.
In addition to the calculation of the false-alarm probability, we tested the reliability of the O I lag recovery for the specific sampling and noise properties of the campaign by performing a lag-injection test. We created a simulated O I λ8446 light curve as a delayed and noisy copy of the Lyα light curve, adopting an input lag of 2.5 days, the observed O I sampling, and the measured O I uncertainties. Applying the same FR and RSS analysis as for the real data, we recovered a median lag of  days. This demonstrates that the HST campaign length and daily cadence are sufficient to reliably recover the lags quoted in Sect. 3.2.
All Figures
|
Fig. 1. Optical mean (blue) and rms (orange) spectra from the HST/STIS campaign. The rms spectrum is scaled (×5) and shifted in flux (−0.25 × 10⁻¹⁵ erg s−1 cm−2 Å−1) to highlight weak line features. The linear pseudo-continuum beneath the O Iλ8446 and the Ca II triplet complex is shown for orientation. The inset shows this spectral region in greater detail, with the rms spectrum scaled (×15) and shifted (−1.5 × 10⁻¹⁵ erg s−1 cm−2 Å−1). The O I λ8446 integration area is shaded in blue (see Sect. 3.2). |
| In the text | |
|
Fig. 2. Comparison of normalized light curves (left panels) of the emission lines O Iλ8446, Lyα, and Hα, together with the UVW2 continuum, with CCFs (right panels) of each pair, showing correlated variability and time delays between the individual emitting components. The CCFs are plotted between 0 and 1. The dashed line indicates τcent. |
| In the text | |
|
Fig. A.1. Distribution of |
| In the text | |
Current usage metrics show cumulative count of Article Views (full-text article views including HTML views, PDF and ePub downloads, according to the available data) and Abstracts Views on Vision4Press platform.
Data correspond to usage on the plateform after 2015. The current usage metrics is available 48-96 hours after online publication and is updated daily on week days.
Initial download of the metrics may take a while.