Fig. 1.
Download original image
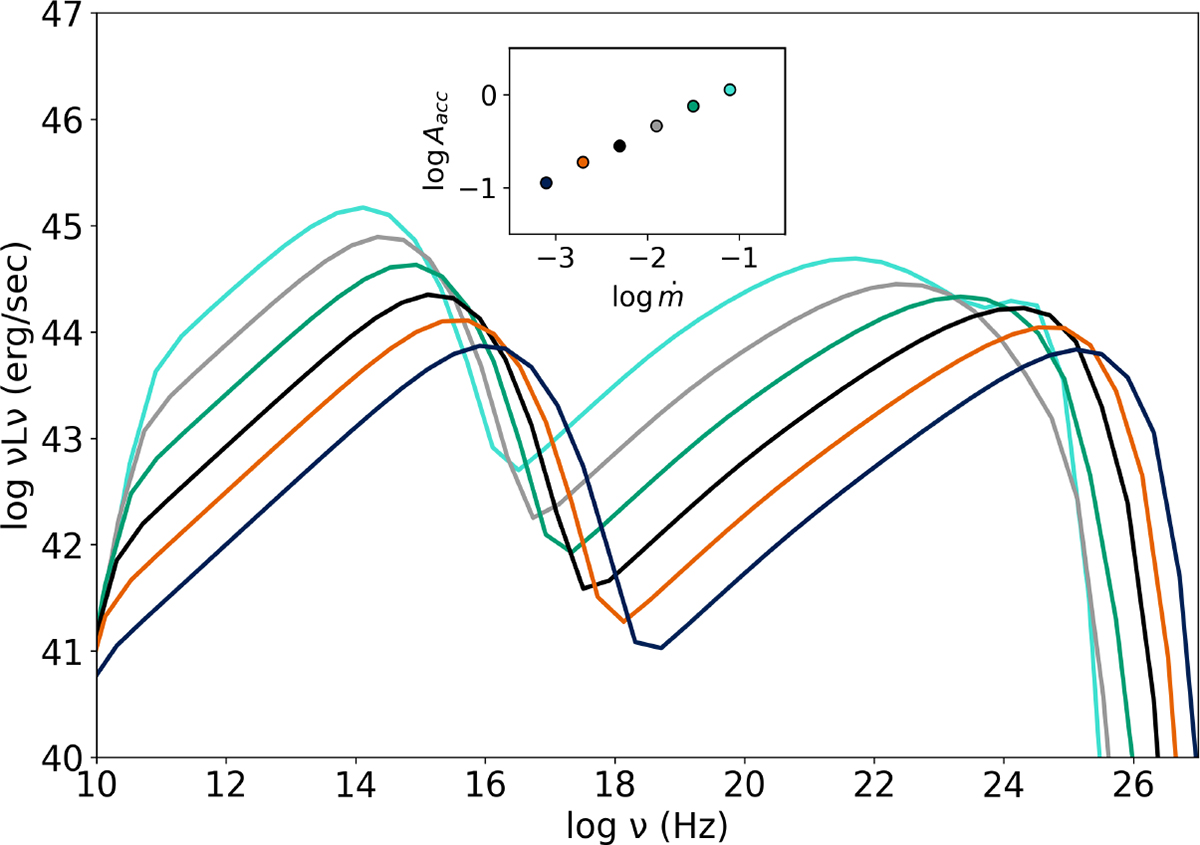
Bottom: Calculated spectral energy distributions of BL Lac objects for various values of the normalized accretion rate ![]() . Inset (top center): Dependence of the acceleration timescale tacc on
. Inset (top center): Dependence of the acceleration timescale tacc on ![]() , showing the nearly linear scaling required to explain BL Lac sources. The colored points correspond to the SED curves, indicating that higher
, showing the nearly linear scaling required to explain BL Lac sources. The colored points correspond to the SED curves, indicating that higher ![]() produces more luminous sources.
produces more luminous sources.
Current usage metrics show cumulative count of Article Views (full-text article views including HTML views, PDF and ePub downloads, according to the available data) and Abstracts Views on Vision4Press platform.
Data correspond to usage on the plateform after 2015. The current usage metrics is available 48-96 hours after online publication and is updated daily on week days.
Initial download of the metrics may take a while.