| Issue |
A&A
Volume 705, January 2026
|
|
|---|---|---|
| Article Number | L5 | |
| Number of page(s) | 5 | |
| Section | Letters to the Editor | |
| DOI | https://doi.org/10.1051/0004-6361/202557600 | |
| Published online | 08 January 2026 | |
A one-parameter two-zone leptonic model for the blazar sequence
1
INAF – Osservatorio Astronomico di Brera, Via E. Bianchi 46, I-23807 Merate, Italy
2
Department of Physics, National and Kapodistrian University of Athens, University Campus Zografos, GR 15783 Athens, Greece
3
NASA Goddard Space Flight Center, Greenbelt, MD, USA
⋆ Corresponding author: This email address is being protected from spambots. You need JavaScript enabled to view it.
Received:
8
October
2025
Accepted:
12
December
2025
Abstract
Blazars, a subclass of radio-loud active galactic nuclei with relativistic jets aligned close to our line of sight, emit highly variable nonthermal radiation across the electromagnetic spectrum. The physical origin of their emission and the blazar sequence remain open questions. We present a self-consistent two-zone leptonic model in which relativistic electrons accelerate in a compact region, losing energy via synchrotron and inverse Compton processes, and escape into a larger zone permeated by an external photon field associated with magnetohydrodynamic winds from the accretion disk. By varying only the mass accretion rate onto the central black hole, the model naturally reproduces the blazar sequence, including Compton dominance, γ-ray spectral indices, and the positions of synchrotron and inverse Compton peaks, while variations in the secondary parameters account for the observed spread in the data. Flat-spectrum radio quasars exhibit strong external Compton emission from the extended zone, whereas BL Lac objects are dominated by synchrotron and synchrotron self-Compton emission from the compact acceleration region. This framework highlights the key role of accretion rate and spatially structured emission zones in shaping blazar spectra and provides a unified interpretation of their diverse phenomenology.
Key words: radiation mechanisms: non-thermal / galaxies: active / galaxies: jets / gamma rays: galaxies
© The Authors 2026
 Open Access article, published by EDP Sciences, under the terms of the Creative Commons Attribution License (https://creativecommons.org/licenses/by/4.0), which permits unrestricted use, distribution, and reproduction in any medium, provided the original work is properly cited.
This article is published in open access under the Subscribe to Open model. This email address is being protected from spambots. You need JavaScript enabled to view it. to support open access publication.
1. Introduction
Blazars, which comprise flat-spectrum radio quasars (FSRQs) and BL Lac objects, are among the most extreme active galactic nuclei (AGN), and have relativistic jets closely aligned to our line of sight (Blandford et al. 2019). Their broadband emission is nonthermal and strongly Doppler-boosted by the bulk relativistic motion of the jet plasma. The spectral energy distribution (SED) of blazars displays two broad components: a low-energy hump, from radio to optical–UV (and occasionally X-rays), attributed to synchrotron radiation from relativistic electrons; and a high-energy hump, from X-rays to GeV–TeV γ-rays, generally interpreted as inverse Compton scattering (ICS) of either the synchrotron photons themselves, i.e., synchrotron self-Compton (SSC), or photons from external fields, i.e., external Compton (EC) (e.g., Dermer et al. 1992; Sikora et al. 1994; Tavecchio et al. 1998; Boula & Mastichiadis 2022). Variability timescales, combined with relativistic beaming and radiative cooling constraints, provide important clues about the size and location of the emitting regions. Additionally, optical and multiwavelength polarization measurements reveal the magnetic field structure and degree of ordering in the emitting regions, providing complementary constraints on particle acceleration and emission site geometry (Liodakis et al. 2022).
The nonthermal particle populations responsible for these SED components must be continuously replenished by in situ acceleration processes within the jet (for a review, see Matthews et al. 2020). Several such mechanisms have been proposed and investigated in the literature: diffusive shock acceleration at relativistic shocks (Blandford & Ostriker 1978; Kirk & Duffy 1999; Shirin T et al. 2025), magnetic reconnection in highly magnetized plasma (for a review, see Sironi et al. 2025), shear (or shear-driven) acceleration operating in velocity-gradient layers of the flow (for a review, see Rieger 2019), stochastic (second-order Fermi) acceleration in turbulent regions (e.g., Katarzyński et al. 2006), or combinations of them (e.g., Tavecchio 2021). The efficiency and relative importance of these processes depend on local magnetization, the flow Lorentz factor and shear, turbulence amplitude and spectrum, and dissipation physics, and may vary across sources and along the jet (Tavecchio 2021).
A systematic trend in the SED properties – called the blazar sequence by Fossati et al. (1998) and the updated sequence by Ghisellini et al. (2017) – shows that as bolometric luminosity Lbol increases, the synchrotron peak frequency  decreases, while the Compton dominance (CD; the IC-to-synchrotron luminosity ratio) and γ-ray spectral slope both increase (Finke 2013). Within this framework, the blazar sequence was interpreted as primarily driven by the accretion power onto the central black hole, a single dominant parameter proposed by Böttcher & Dermer (2002) and independently by Cavaliere & D’Elia (2002). The original sequence, based on a sample of 132 objects with only 33 γ-ray detections, has been refined with Fermi-LAT observations, thus expanding the γ-ray–detected blazar sample to over 5000 sources (The Fermi-LAT collaboration 2020) and suggesting that the sequence may ultimately reflect fundamental AGN parameters.
The optically thin nature of blazar GeV emission places the γ-ray production site far from the immediate vicinity of the black hole (BH), possibly at distances up to ∼106RS (∼10 pc), for MBH ∼ 108 M⊙, where RS is the Schwarzschild radius (Marscher et al. 2010). On these scales, the dusty molecular tori invoked in AGN unification (Antonucci & Miller 1985) may interact significantly with the jet. A compelling picture identifies these structures as magnetohydrodynamic (MHD) accretion-disk winds (Konigl & Kartje 1994; Contopoulos & Lovelace 1994), launched from a few RS out to the BH sphere of influence (∼106RS). Observations of warm absorbers, which are blueshifted absorption features successfully modeled as photoionized MHD winds extending to comparable distances (Behar 2009; Fukumura et al. 2010), support this interpretation. Similar winds inferred in stellar-mass black hole systems (Fukumura et al. 2017) suggest a scale-invariant phenomenon.
The physical properties of these MHD winds depend primarily on a small set of parameters and, most notably, on the mass accretion rate. Previous work showed that varying only this parameter can, in principle, reproduce the main trends of the blazar sequence (Boula et al. 2019a, 2019b). To explain the observed multiwavelength spectrum, we adopted a two-zone framework. In the compact acceleration region considered here, particle energization can occur, for instance, through diffusive shock acceleration, after which electrons escape into a larger-scale cooling zone where radiative losses dominate. Building on this idea, we developed a two-zone emission model in which electrons are accelerated near the central engine and subsequently escape into a cooling zone, where interactions with the ambient photon field associated with the MHD wind can dominate the high-energy emission.
This Letter is structured as follows. In Sect. 2 we describe the emission model and its scalings with mass accretion rate. In Sect. 3 we present the two-zone emission framework. In Sect. 4 we summarize our conclusions.
2. Scaling of particle emission and acceleration with mass accretion rate
In our previous work, Boula et al. (2019a), we modeled blazar emission with relativistic electrons radiating via synchrotron and Compton processes, the latter involving seed photons originating from the MHD wind. By varying only the mass accretion rate, the model reproduced the observed correlations between the synchrotron peak, the gamma-ray index, and the Compton dominance. A natural next step is to include explicit particle acceleration physics, which can arise from shocks, turbulence, or shear flows (e.g., Kirk et al. 1998; Rieger & Mannheim 2002).
To capture these effects, we introduced a characteristic acceleration timescale tacc, parameterized to depend on  . For first-order Fermi acceleration at relativistic shocks, the timescale can be written
  , with us the shock speed in the comoving frame, λ the particle mean free path, and rg = γmc2/(eB) the gyroradius. The spectral shape of blazars depends on the ratio of magnetic to photon energy densities. Following Boula et al. (2019a), we assume partial equipartition between magnetic and accretion power, with accretion luminosity
  , where LEdd = 1.28 × 1038 erg s−1,
  is the Eddington-normalized accretion rate, and
  . The magnetic energy density at distance z then scales as
  , with ηb a proportionality constant. We assume that the external photon field originates from accretion-disk photons scattered by the MHD wind. The scattering region extends from a radial distance R1 to R2 along the wind, with electron density n(r)=n0(r/Rs)−1 following our MHD wind prescription (Contopoulos & Lovelace 1994). The energy density of scattered photons in the jet comoving frame is Uext = Γ2Usc, where Usc ≃ LdiskτT/(4πR22c), and the wind Thomson depth is τT = n0σTRsln(R2/R1), where
  . Here
  , with α = 1 for radiatively efficient disks (FSRQs) and α = 2 for ADAF-like disks (BL Lac obects), and ϵ is the radiative efficiency. Therefore, the photon field energy density scales as
  .
.
The emission is assumed to arise from a stationary spherical zone of radius Rb located at some distance z along the jet. The blob moves with bulk Lorentz factor Γ at angle θ to the line of sight, giving Doppler factor δ = [Γ(1 − βcosθ]−1. Particles are accelerated on a timescale  . In the framework of diffusive (Fermi I) shock acceleration, the acceleration timescale depends on the particle gyroradius and the shock speed, and can be indirectly linked to the accretion rate through the magnetic field strength, since
  in standard jet–disk coupling scenarios. We initially tested this physical dependence, but found that it could not reproduce the observed trend of softer spectral peaks in high accretion rate sources. To investigate this effect without introducing additional free parameters, we therefore adopted a phenomenological scaling in which the acceleration timescale increases linearly with the accretion rate,
  . This prescription effectively captures the possibility that more powerful (high
  ) systems may experience slower particle acceleration, for example due to reduced turbulence or more complex shock geometries.
The electron distribution in the acceleration region is governed by the kinetic equation
![Mathematical equation: $$ \begin{aligned} \frac{\partial n_{e}(\gamma ,t)}{\partial t} + \frac{n_{e}(\gamma ,t)}{t_{\rm esc}} = Q_{\rm inj} + \mathcal{L} _{\rm syn}(\gamma ,t) + \mathcal{L} _{\rm ICS}(\gamma ,t) + \frac{\partial }{\partial \gamma } \left[\frac{\gamma \, n_e(\gamma ,t)}{t_{\rm acc}}\right], \end{aligned} $$](/articles/aa/full_html/2026/01/aa57600-25/aa57600-25-eq15.gif) (1)
(1)
where ne(γ, t) is the differential distribution, tesc the escape timescale, Qinj the injection term, and ℒsyn and ℒICS the synchrotron and inverse Compton loss terms (Mastichiadis & Kirk 1995). Solving the coupled electron–photon equations for  , we find that reproducing the blazar sequence requires tacc to scale nearly linearly with
  (Fig. 1, inset).
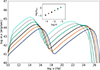 |
Fig. 1. Bottom: Calculated spectral energy distributions of BL Lac objects for various values of the normalized accretion rate |


This section establishes a one-zone leptonic framework where both the acceleration timescale and the external photon field depend on the mass accretion rate. In the next section we extend this approach by embedding the acceleration region in a larger cooling zone, moving from a one-zone description to a two-zone emission model.
3. Particle escape: A two-zone emission model
In order to take into account that the high-energy electrons escaping the acceleration zone still undergo ICS losses from the scattered disk photons on the wind, we extend the one-zone model presented in the previous section onto a two-zone scenario. Thus, we consider that particles are accelerated in a compact region near the central engine (acceleration zone, zone I), then escape into a larger volume farther along the jet (cooling zone, zone II), where they continue to radiate via synchrotron and inverse Compton processes (Fig. 2).
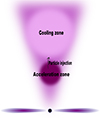 |
Fig. 2. Sketch of the two-zone model. Particles accelerate and radiate in the acceleration zone (dark blue). A fraction escapes into the cooling zone (light blue), where it continues to radiate. |
The kinetic equation for electrons in the acceleration zone is described by Eq. (1). In the cooling zone, the kinetic equation is
 (2)
(2)
with tescII = RII/c set by the light-crossing time of the cooling zone, and  representing electrons escaping from zone I and injected into zone II. The acceleration and cooling regions in our model differ in size by about one order of magnitude (RII ≃ 10RI). Regarding the transition between these zones, we explicitly compared the relevant energy loss timescales. While the volume expansion implies adiabatic cooling, this channel is negligible for the high-energy particle population. The external photon field is assumed constant along the jet, originating from isotropic scattering of accretion-disk photons by the MHD wind (Section 2). The magnetic field decreases with distance as B ∝ 1/z, consistent with magnetic flux conservation in a conical jet.
The two-zone framework is depicted in Fig. 3. BL Lac and FSRQ objects exhibit distinct emission patterns, reflecting their different mass accretion rates and the resulting variations in key physical parameters such as magnetic field, external photon energy density, and acceleration efficiency (see Table A.1). In BL Lac objects the magnetic energy density dominates over the external photon field in both the acceleration and cooling zones. In the acceleration zone, synchrotron emission is therefore the primary radiative process. In contrast, in the cooling zone, although the magnetic field decreases with distance, it still satisfies UBII ≫ Uext. As a result, the cooling zone contributes little to the total flux, and the overall spectrum is primarily determined by the acceleration zone (Fig. 3). Instead, FSRQs display a more complex behavior. Synchrotron emission dominates in the acceleration zone, where UBI > Uext, but in the cooling zone the magnetic field decreases. In contrast, the external photon field remains approximately constant, Boula et al. (2019a), leading to Uext ≫ UBII. Consequently, external Compton scattering dominates the energy losses in the cooling zone, giving rise to the characteristic two-component SED observed in FSRQs, with low-energy synchrotron emission from the acceleration zone and high-energy external Compton emission from the cooling zone.
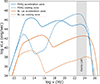 |
Fig. 3. Results for FSRQ and BL Lac objects according to the two-zone model. Straight lines represent the emission from the acceleration zone, and dotted lines represent the emission from the cooling zone. The shaded region depicts the Fermi γ-ray energy band. |
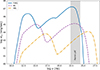 |
Fig. 4. Theoretical blazar sequence according to the superposition of the two-zone emission by varying only the mass accretion rate (see Table A.1 for the values of the input parameters). |
In Fig. 4 we present our results for a theoretical blazar sequence in the two-zone model (see Table A.1 for the input parameters and Table A.2 for the resulting spectral peak properties). In all classes, particles escape from the acceleration zone. FSRQs exhibit a strong γ-ray signature because electrons injected into the cooling zone interact with a dense external photon field, whereas in BL Lacs the escaping particles interact only weakly with the external field, and the cooling zone contributes less to the total flux. This two-zone approach is fully consistent with the statistical trends observed by Fermi-LAT, including the Compton dominance, the γ-ray spectral indices, and the positions of the synchrotron and inverse Compton peaks. The values in Tables A.1 and A.2 show that these trends can be reproduced by varying only the mass accretion rate, which emerges as the key physical driver of the sequence, as demonstrated in Boula et al. (2019a). The same study shows that the black hole mass cannot account for the observational spread of the data. Although the black hole mass and the location of the emission region can both affect the details, their influence is subdominant compared to the role of  . Furthermore, by allowing variations in the acceleration timescale, the electron injection properties, and the magnetic field efficiency, the two-zone framework can reproduce not only the systematic sequence, but also the observed spread in the data, consistent with our previous one-zone study (Boula et al. 2019a, 2019b). This demonstrates that the combination of mass accretion rate scaling and a two-zone treatment of particle escape provides a robust framework for capturing both the systematic and statistical features of the blazar population.
Figure 5 illustrates the application of the two-zone model to the FSRQ 3C273, focusing on the X-ray and γ-ray bands. SSC primarily produces X-ray emission in the compact acceleration zone, where relativistic electrons upscatter synchrotron photons. The cooling zone dominates the γ-ray emission through external Compton scattering, where electrons interact with ambient photons from the MHD wind or the broad-line region. This two-zone scenario naturally explains the distinct emission components and spectral features observed in 3C273. For the parameters adopted (e.g., BII ≈ 0.1 G, RII ≈ 3 × 1017 cm, and uexp ≈ 0.01c), the synchrotron cooling timescale tsyn is significantly shorter than the adiabatic expansion timescale tad ≈ R/uexp for electrons with γ ≳ 200. Consequently, the radiating electrons lose their energy via synchrotron emission before they undergo significant adiabatic decompression.
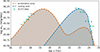 |
Fig. 5. Application of the two-zone model to the FSRQ 3C273, focusing on the high-energy spectral range. The acceleration zone is located at z = 0.01 pc, with a magnetic field strength of B = 1 G and radius RI = 5 × 1015 cm, the cooling zone is one order of magnitude more distant and larger than the acceleration zone. The external photon field arises from isotropic scattering of disk photons on wind particles between radii R1 = 9 × 1014 cm and R2 = 3 × 1018 cm, with energy density Uext = 2.5 × 10⁻³ erg cm−3. The bulk Lorentz factor is Γ = 30, the Doppler factor is δ = 15, and the characteristic disk temperature is Tdisk = 3 × 10⁴ K. The observational data are from Giommi et al. (2012). |
4. Conclusion
For this work we successfully reproduced the theoretical blazar sequence by extending the model of Boula et al. (2019a), using the mass accretion rate as the primary physical parameter to account for the broad diversity observed in blazar phenomenology. This demonstrates that a simple physically grounded approach where changes in accretion rate alone drive the differences between flat-spectrum radio quasars (FSRQs) and BL Lacertae objects (BL Lacs) is consistent with the blazar unification paradigm.
Our model solves the coupled kinetic equations for electrons and photons self-consistently, including Fermi acceleration, synchrotron, and inverse Compton losses, within a two-zone emission framework. Electrons accelerate in a compact region and partially escape into a larger cooling zone, naturally producing the distinct spectral components characteristic of blazars. The competition between magnetic and external photon field energy densities, modulated by the accretion rate, explains the dominance of synchrotron and SSC emission in BL Lacs versus strong external Compton emission in FSRQs.
Importantly, this approach reproduces not only the main trends of the blazar sequence, but also the observed statistical distributions reported by Fermi-LAT, including Compton dominance, γ-ray spectral indices, and the locations of the synchrotron and inverse Compton peaks. Application of the model to the well-studied FSRQ 3C273 captures key features of its broadband SED, confirming that variations in accretion power are sufficient to account for its high-energy emission.
An interesting implication of the two-zone framework is that, in a flaring state, FSRQs may exhibit a time delay in the γ-ray emission relative to the X-rays. Initially, γ-rays are produced simultaneously with X-rays in the acceleration zone, but additional γ-ray emission arises from the cooling zone as electrons propagate and radiate. The duration of the γ-ray pulse is therefore set primarily by the electron cooling timescale since freshly accelerated ones do not immediately replace cooled electrons. Detailed modeling of this effect requires a time-dependent approach. A similar argument applies to the radio emission, which is expected to appear later due to the longer cooling and propagation timescales of the lower-energy electrons.
Overall, our results underscore the central role of the mass accretion rate in shaping blazar spectra within a unified theoretical framework grounded in particle acceleration physics and radiative transfer. The inclusion of particle escape and spatially structured emission zones provides a more realistic interpretation of blazar spectra. Future refinements, including jet stratification, time variability, and polarization studies, will further enhance the predictive power of the model. However, the present work establishes a robust foundation that links accretion physics, jet emission, and blazar phenomenology.
Acknowledgments
We thank the anonymous referee for their useful comments. We thank Yannis Liodakis for the helpful feedback on the manuscript and Fabrizio Tavecchio for valuable discussions. We have used the following Python libraries: Numpy (Harris et al. 2020), Matplotlib (Hunter 2007), Scipy (Virtanen et al. 2020).
References
- Antonucci, R. R. J., & Miller, J. S. 1985, ApJ, 297, 621 [NASA ADS] [CrossRef] [Google Scholar]
- Behar, E. 2009, ApJ, 703, 1346 [NASA ADS] [CrossRef] [Google Scholar]
- Blandford, R. D., & Ostriker, J. P. 1978, ApJ, 221, L29 [Google Scholar]
- Blandford, R., Meier, D., & Readhead, A. 2019, ARA&A, 57, 467 [NASA ADS] [CrossRef] [Google Scholar]
- Böttcher, M., & Dermer, C. D. 2002, ApJ, 564, 86 [CrossRef] [Google Scholar]
- Boula, S., & Mastichiadis, A. 2022, A&A, 657, A20 [NASA ADS] [CrossRef] [EDP Sciences] [Google Scholar]
- Boula, S., Kazanas, D., & Mastichiadis, A. 2019a, MNRAS, 482, L80 [NASA ADS] [CrossRef] [Google Scholar]
- Boula, S., Kazanas, D., & Mastichiadis, A. 2019b, in High Energy Phenomena in Relativistic Outflows VII, 9 [Google Scholar]
- Cavaliere, A., & D’Elia, V. 2002, ApJ, 571, 226 [NASA ADS] [CrossRef] [Google Scholar]
- Contopoulos, J., & Lovelace, R. V. E. 1994, ApJ, 429, 139 [NASA ADS] [CrossRef] [Google Scholar]
- Dermer, C. D., Schlickeiser, R., & Mastichiadis, A. 1992, A&A, 256, L27 [NASA ADS] [Google Scholar]
- Finke, J. D. 2013, ApJ, 763, 134 [NASA ADS] [CrossRef] [Google Scholar]
- Fossati, G., Maraschi, L., Celotti, A., Comastri, A., & Ghisellini, G. 1998, MNRAS, 299, 433 [Google Scholar]
- Fukumura, K., Kazanas, D., Contopoulos, I., & Behar, E. 2010, ApJ, 715, 636 [NASA ADS] [CrossRef] [Google Scholar]
- Fukumura, K., Kazanas, D., Shrader, C., et al. 2017, Nat. Astron., 1, 0062 [NASA ADS] [CrossRef] [Google Scholar]
- Ghisellini, G., Righi, C., Costamante, L., & Tavecchio, F. 2017, MNRAS, 469, 255 [NASA ADS] [CrossRef] [Google Scholar]
- Giommi, P., Polenta, G., Lähteenmäki, A., et al. 2012, A&A, 541, A160 [NASA ADS] [CrossRef] [EDP Sciences] [Google Scholar]
- Harris, C. R., Millman, K. J., van der Walt, S. J., et al. 2020, Nature, 585, 357 [NASA ADS] [CrossRef] [Google Scholar]
- Hunter, J. D. 2007, Comput. Sci. Eng., 9, 90 [NASA ADS] [CrossRef] [Google Scholar]
- Katarzyński, K., Ghisellini, G., Mastichiadis, A., Tavecchio, F., & Maraschi, L. 2006, A&A, 453, 47 [NASA ADS] [CrossRef] [EDP Sciences] [Google Scholar]
- Kirk, J. G., & Duffy, P. 1999, J. Phys. G Nucl. Phys., 25, R163 [Google Scholar]
- Kirk, J. G., Rieger, F. M., & Mastichiadis, A. 1998, A&A, 333, 452 [NASA ADS] [Google Scholar]
- Konigl, A., & Kartje, J. F. 1994, ApJ, 434, 446 [NASA ADS] [CrossRef] [Google Scholar]
- Liodakis, I., Marscher, A. P., Agudo, I., et al. 2022, Nature, 611, 677 [CrossRef] [Google Scholar]
- Marscher, A. P., Jorstad, S. G., Larionov, V. M., et al. 2010, ApJ, 710, L126 [Google Scholar]
- Mastichiadis, A., & Kirk, J. G. 1995, A&A, 295, 613 [NASA ADS] [Google Scholar]
- Matthews, J. H., Bell, A. R., & Blundell, K. M. 2020, New Astron. Rev., 89, 101543 [CrossRef] [Google Scholar]
- Rieger, F. M. 2019, Galaxies, 7, 78 [NASA ADS] [CrossRef] [Google Scholar]
- Rieger, F. M., & Mannheim, K. 2002, A&A, 396, 833 [NASA ADS] [CrossRef] [EDP Sciences] [Google Scholar]
- Shirin T, A., Reville, B., Schween, N. W., Schulze, F., & Kirk, J. G. 2025, MNRAS, 544, L160 [Google Scholar]
- Sikora, M., Begelman, M. C., & Rees, M. J. 1994, ApJ, 421, 153 [Google Scholar]
- Sironi, L., Uzdensky, D. A., & Giannios, D. 2025, ARA&A, 63, 127 [Google Scholar]
- Tavecchio, F. 2021, MNRAS, 501, 6199 [Google Scholar]
- Tavecchio, F., Maraschi, L., & Ghisellini, G. 1998, ApJ, 509, 608 [Google Scholar]
- The Fermi-LAT collaboration (Ajello, M., et al.) 2020, ApJ, 892, 105 [NASA ADS] [CrossRef] [Google Scholar]
- Virtanen, P., Gommers, R., Oliphant, T. E., et al. 2020, Nat. Methods, 17, 261 [Google Scholar]
Appendix A: Parameters and results of the theoretical blazar sequence
In Tables A.1 and A.2 we present the input parameters of the theoretical blazar sequence and the main characteristics of the produced spectral energy distributions that are in agreement with the observational trends of fermi blazars (The Fermi-LAT collaboration 2020).
Input parameters (log scale) of the theoretical blazar sequence for ℳ = 108 (see Fig. 4).
Resulting peak frequencies and luminosities of the synchrotron and inverse Compton components in the theoretical blazar sequence.
All Tables
Input parameters (log scale) of the theoretical blazar sequence for ℳ = 108 (see Fig. 4).
Resulting peak frequencies and luminosities of the synchrotron and inverse Compton components in the theoretical blazar sequence.
All Figures
|
Fig. 1. Bottom: Calculated spectral energy distributions of BL Lac objects for various values of the normalized accretion rate |
| In the text | |
|
Fig. 2. Sketch of the two-zone model. Particles accelerate and radiate in the acceleration zone (dark blue). A fraction escapes into the cooling zone (light blue), where it continues to radiate. |
| In the text | |
|
Fig. 3. Results for FSRQ and BL Lac objects according to the two-zone model. Straight lines represent the emission from the acceleration zone, and dotted lines represent the emission from the cooling zone. The shaded region depicts the Fermi γ-ray energy band. |
| In the text | |
|
Fig. 4. Theoretical blazar sequence according to the superposition of the two-zone emission by varying only the mass accretion rate (see Table A.1 for the values of the input parameters). |
| In the text | |
|
Fig. 5. Application of the two-zone model to the FSRQ 3C273, focusing on the high-energy spectral range. The acceleration zone is located at z = 0.01 pc, with a magnetic field strength of B = 1 G and radius RI = 5 × 1015 cm, the cooling zone is one order of magnitude more distant and larger than the acceleration zone. The external photon field arises from isotropic scattering of disk photons on wind particles between radii R1 = 9 × 1014 cm and R2 = 3 × 1018 cm, with energy density Uext = 2.5 × 10⁻³ erg cm−3. The bulk Lorentz factor is Γ = 30, the Doppler factor is δ = 15, and the characteristic disk temperature is Tdisk = 3 × 10⁴ K. The observational data are from Giommi et al. (2012). |
| In the text | |
Current usage metrics show cumulative count of Article Views (full-text article views including HTML views, PDF and ePub downloads, according to the available data) and Abstracts Views on Vision4Press platform.
Data correspond to usage on the plateform after 2015. The current usage metrics is available 48-96 hours after online publication and is updated daily on week days.
Initial download of the metrics may take a while.