Open Access
Fig. 3.
Download original image
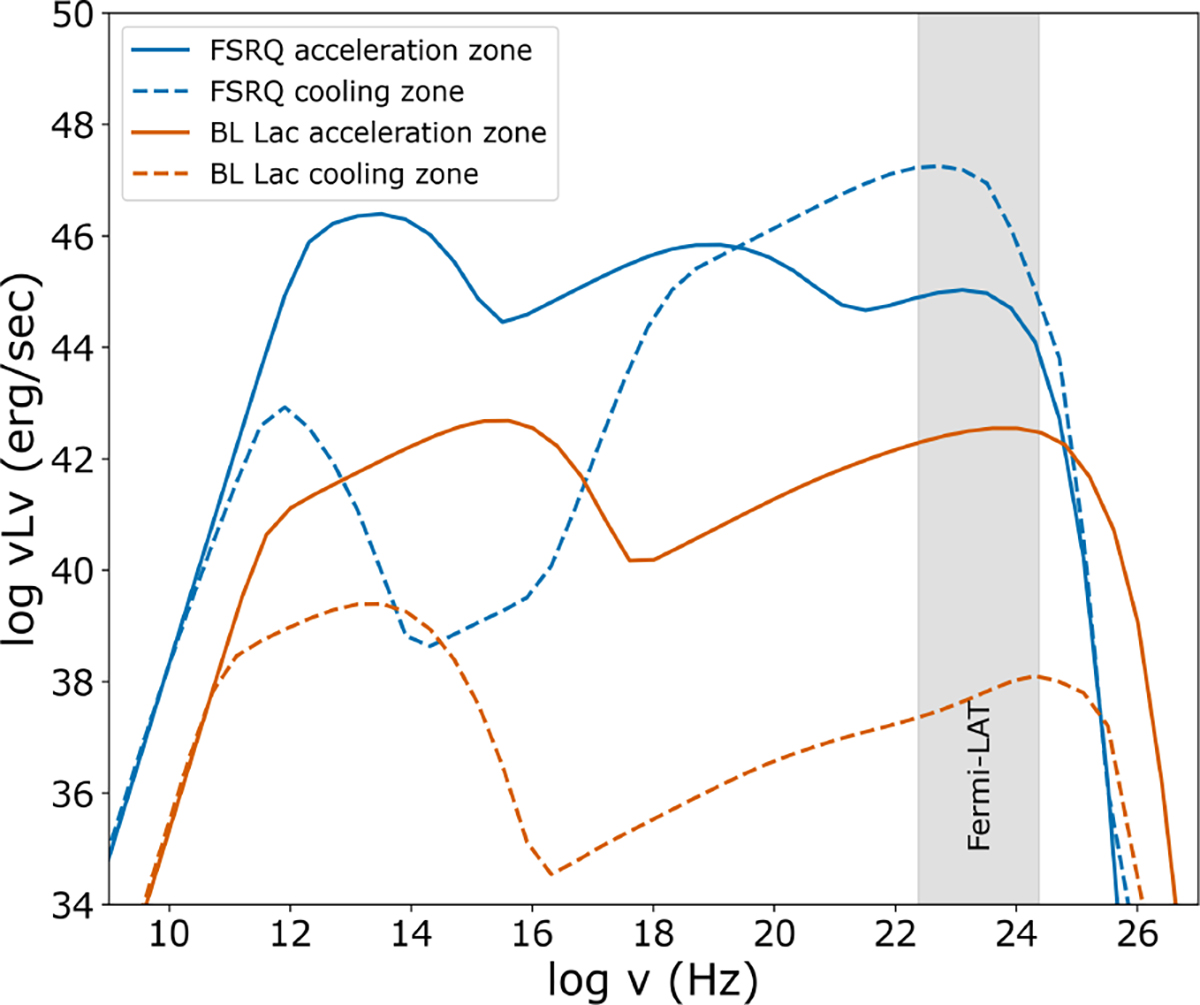
Results for FSRQ and BL Lac objects according to the two-zone model. Straight lines represent the emission from the acceleration zone, and dotted lines represent the emission from the cooling zone. The shaded region depicts the Fermi γ-ray energy band.
Current usage metrics show cumulative count of Article Views (full-text article views including HTML views, PDF and ePub downloads, according to the available data) and Abstracts Views on Vision4Press platform.
Data correspond to usage on the plateform after 2015. The current usage metrics is available 48-96 hours after online publication and is updated daily on week days.
Initial download of the metrics may take a while.