Fig. 1
Download original image
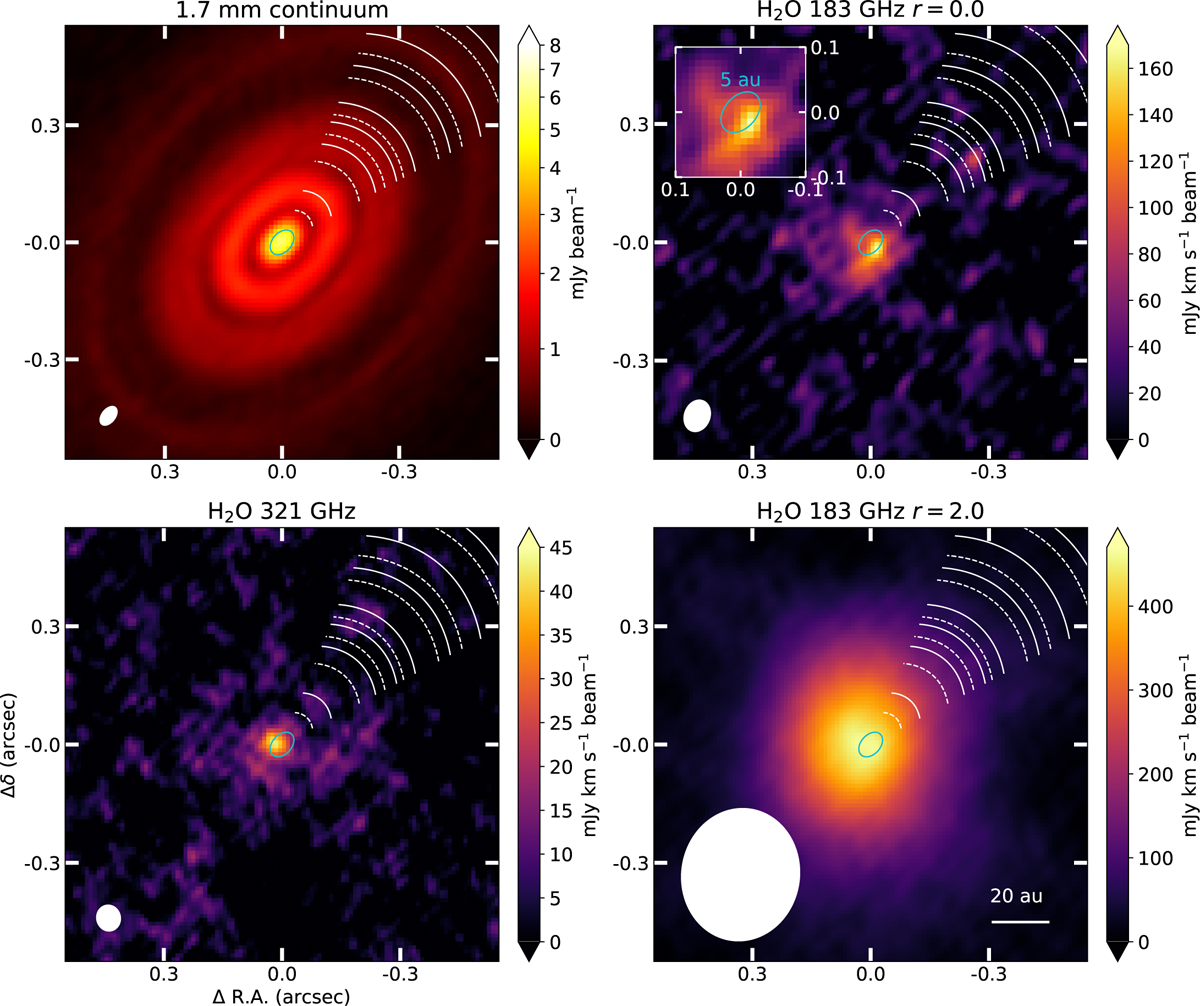
ALMA Band 5 images of the HL Tau disk and the 321 GHz H2O line. Top left: continuum. Right panels: JvM-corrected integrated intensity maps of the H2O line at 183 GHz imaged with r = 0.0 (top) and r = 2.0 (bottom). These maps provide high and moderate spatial resolution. Top-right inset: zoomed-in view of the inner 0′′.2. This highlights the approximate water snow line location derived by Guerra-Alvarado et al. (2024) Bottom left: reimaged H2O 321 GHz line originally presented in Facchini et al. (2024). The beams are indicated in the bottom-left corners of the respective panels. The dust rings and gaps derived from high-resolution ALMA observations are indicated with solid and dashed arcs in each panel (ALMA Partnership 2015; Carrasco-González et al. 2019; Guerra-Alvarado et al. 2024), and a 20 au scale bar is shown in the bottom-right corner of the bottom-right panel.
Current usage metrics show cumulative count of Article Views (full-text article views including HTML views, PDF and ePub downloads, according to the available data) and Abstracts Views on Vision4Press platform.
Data correspond to usage on the plateform after 2015. The current usage metrics is available 48-96 hours after online publication and is updated daily on week days.
Initial download of the metrics may take a while.