Open Access
Fig. A.3
Download original image
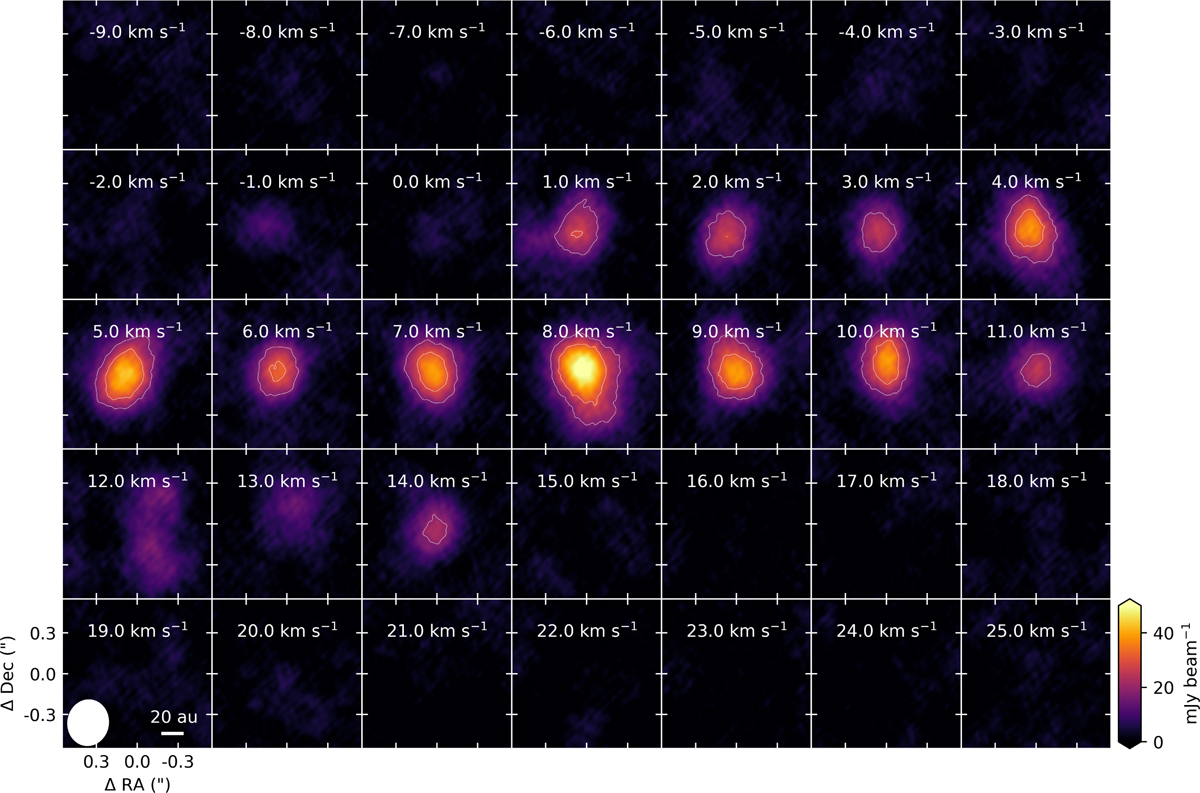
Channel maps of the H2O line at 183 GHz imaged with a robust parameter of 2.0. The white contours indicate the 3σ and 5σ confidence intervals, where 1σ corresponds to 5-7 mJy beam−1 depending on the velocity channel (see Appendix A.1). The beam and a 20 au scale bar are indicated in the bottom-left panel.
Current usage metrics show cumulative count of Article Views (full-text article views including HTML views, PDF and ePub downloads, according to the available data) and Abstracts Views on Vision4Press platform.
Data correspond to usage on the plateform after 2015. The current usage metrics is available 48-96 hours after online publication and is updated daily on week days.
Initial download of the metrics may take a while.