Fig. A.4
Download original image
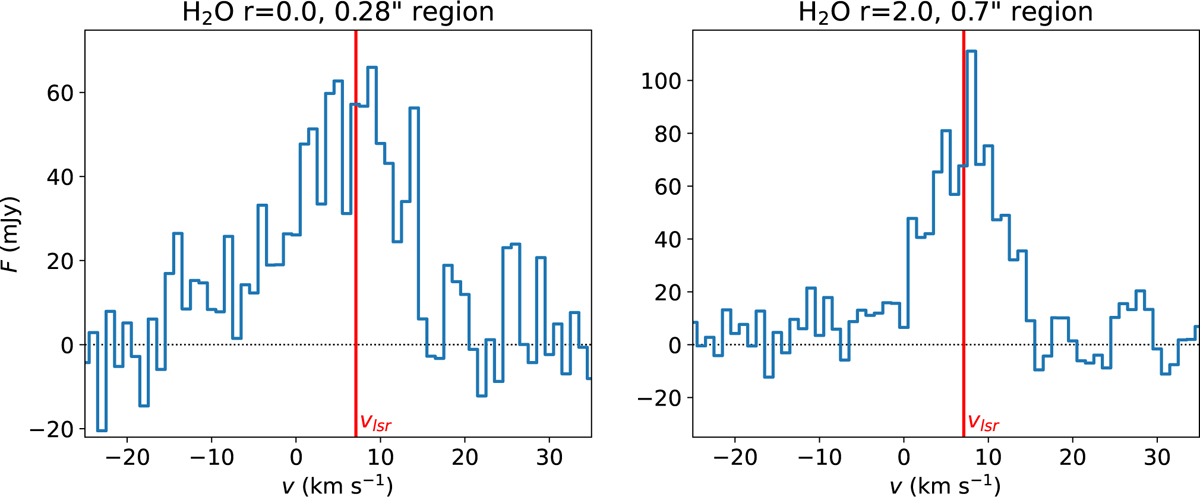
Spectra of the H2O emission extracted from the same regions used to calculate the disk-integrated flux without shifting and stacking the data. Left: Spectrum of the line imaged with a robust parameter of 0.0. Right: Spectrum when imaging with a robust parameter of 2.0. The source velocity of the HL Tau system is indicated by the vertical red line.
Current usage metrics show cumulative count of Article Views (full-text article views including HTML views, PDF and ePub downloads, according to the available data) and Abstracts Views on Vision4Press platform.
Data correspond to usage on the plateform after 2015. The current usage metrics is available 48-96 hours after online publication and is updated daily on week days.
Initial download of the metrics may take a while.