Fig. A.9
Download original image
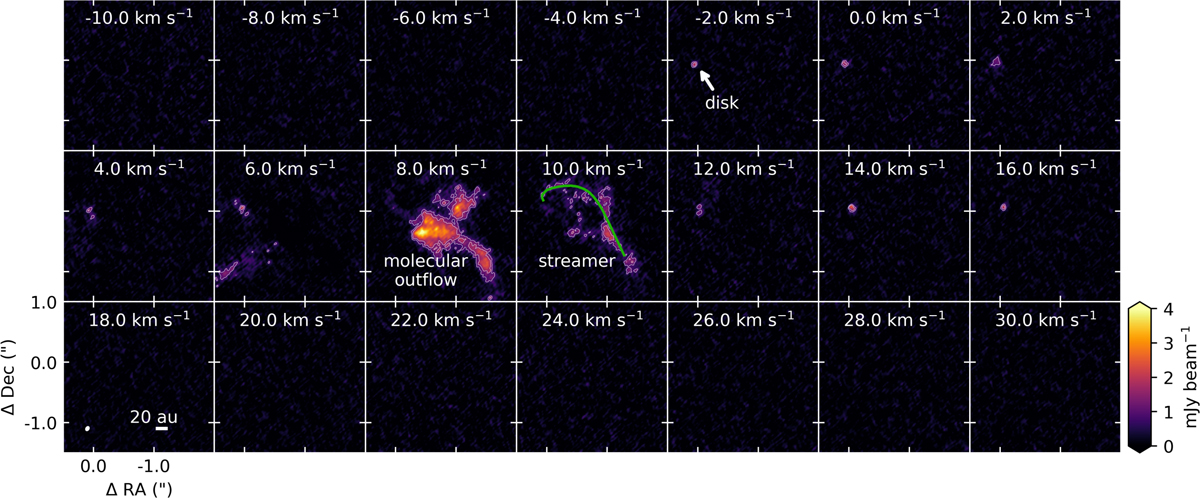
Channel maps of the SO 44 − 33 line. The channels at 8 and 10 km s−1 primarily trace the molecular outflow and the streamer, respectively. The green line in the 10 km s−1 channel is the fit to the one-arm spiral tracing the streamer in HCO+ (Yen et al. 2019). The white contours indicate the 3σ and 5σ confidence levels, where 1σ corresponds to 0.3 mJy beam−1. We note that the position of the disk is off center with respect to the center of the channel maps.
Current usage metrics show cumulative count of Article Views (full-text article views including HTML views, PDF and ePub downloads, according to the available data) and Abstracts Views on Vision4Press platform.
Data correspond to usage on the plateform after 2015. The current usage metrics is available 48-96 hours after online publication and is updated daily on week days.
Initial download of the metrics may take a while.