Fig. A.10
Download original image
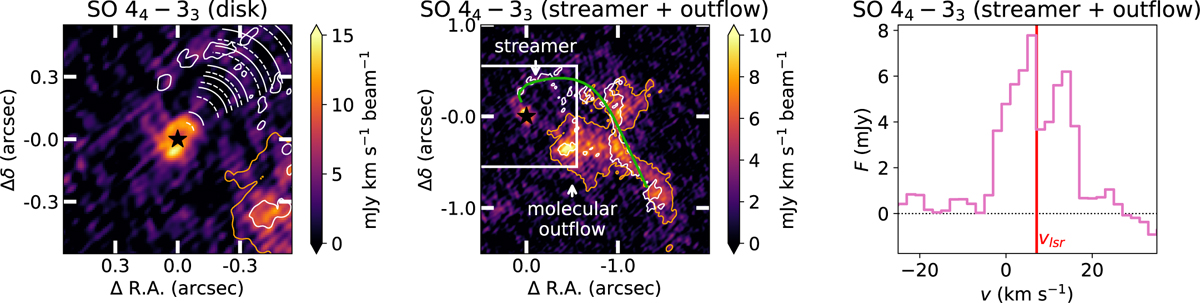
SO emission in the HL Tau system. Left and middle: Integrated intensity maps of the SO emission. The left panel presents the map integrated from -5 to 19 km s−1 zoomed in on the HL Tau disk, and the middle panel shows the emission integrated over a smaller velocity range from 5 to 13 km s−1, highlighting the emission coming from primarily the streamer (white) and the molecular outflow (orange contour). The green line in the middle panel is the fit to the one-arm spiral tracing the streamer in HCO+ (Yen et al. 2019). Right: SO spectrum.
Current usage metrics show cumulative count of Article Views (full-text article views including HTML views, PDF and ePub downloads, according to the available data) and Abstracts Views on Vision4Press platform.
Data correspond to usage on the plateform after 2015. The current usage metrics is available 48-96 hours after online publication and is updated daily on week days.
Initial download of the metrics may take a while.