Fig. 2
Download original image
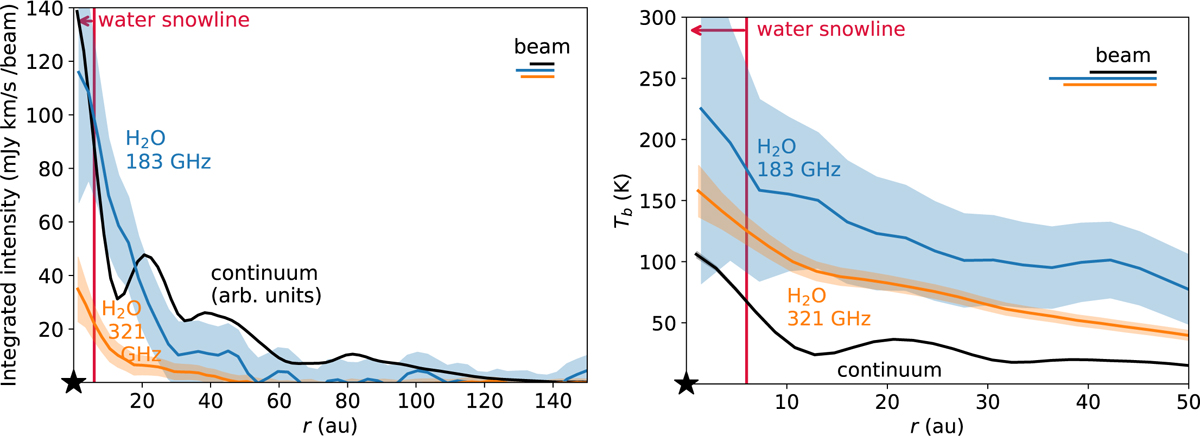
Azimuthally averaged radial profiles of the integrated intensity (left) and brightness temperature (right). The H2O line at 183 GHz imaged with a robust parameter of 0.0 is indicated in blue, the H2O line at 321 GHz in orange, and the continuum emission in black. In the left panel the continuum emission is presented in arbitrary units, and the upper limit on the water snow line location is indicated with the vertical red line. Note the difference in the radial axes. The beams are indicated with the horizontal bars in the top-right corner.
Current usage metrics show cumulative count of Article Views (full-text article views including HTML views, PDF and ePub downloads, according to the available data) and Abstracts Views on Vision4Press platform.
Data correspond to usage on the plateform after 2015. The current usage metrics is available 48-96 hours after online publication and is updated daily on week days.
Initial download of the metrics may take a while.