Fig. 3
Download original image
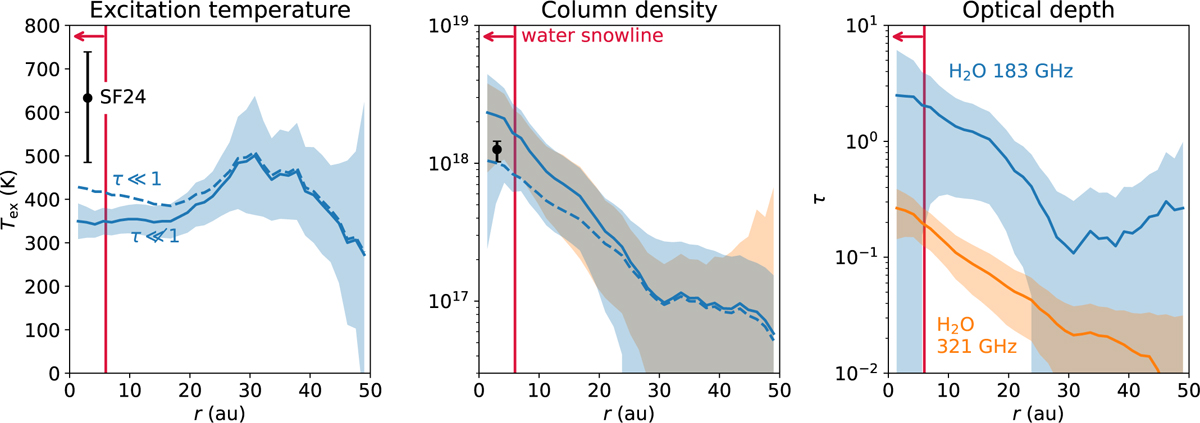
Radially resolved rotational diagram analysis of the H2O emission in the HL Tau disk. The excitation temperature (left), column density (middle), and optical depth (right) of the H2O 183 GHz (blue) and 321 GHz (orange) lines are obtained after convolving the two lines to the same beam size. The dashed lines are derived under the assumption of fully optically thin emission, whereas the solid lines include the correction for the optical depth of the lines. The black scatter points indicate the disk-averaged results from Facchini et al. (2024) assuming an emitting region of 17 au; the upper limit on the water snow line location is indicated with the vertical red line.
Current usage metrics show cumulative count of Article Views (full-text article views including HTML views, PDF and ePub downloads, according to the available data) and Abstracts Views on Vision4Press platform.
Data correspond to usage on the plateform after 2015. The current usage metrics is available 48-96 hours after online publication and is updated daily on week days.
Initial download of the metrics may take a while.