Fig. 5
Download original image
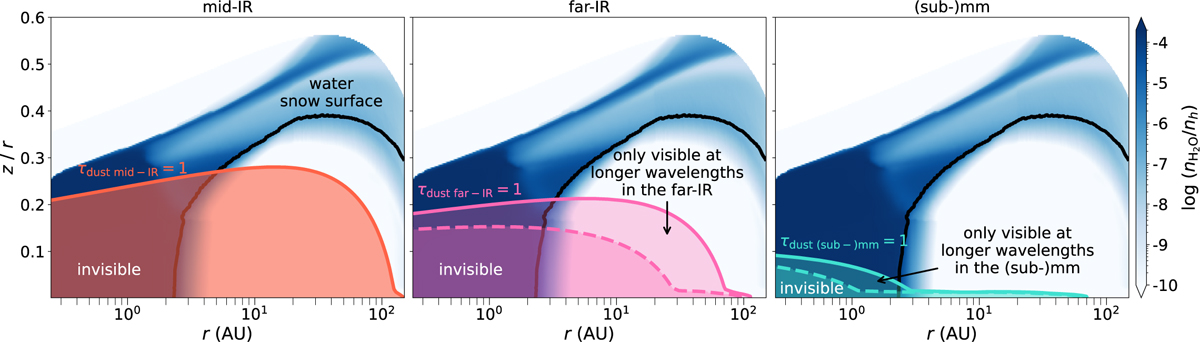
Abundance of gas-phase H2O in a representative model for the HL Tau disk (colored background). The orange, pink, and cyan contours indicate the τdust = 1 surface for the lines in Table 3 in the mid-IR, far-IR, and (sub)millimeter, respectively. In the middle and right panels the solid and dashed lines indicate the long- and short-wavelength ends of the range of lines in Table 3, in the far-IR and (sub)millimeter, respectively. The water snow surface in the model is indicated with the black contour.
Current usage metrics show cumulative count of Article Views (full-text article views including HTML views, PDF and ePub downloads, according to the available data) and Abstracts Views on Vision4Press platform.
Data correspond to usage on the plateform after 2015. The current usage metrics is available 48-96 hours after online publication and is updated daily on week days.
Initial download of the metrics may take a while.