Fig. 7
Download original image
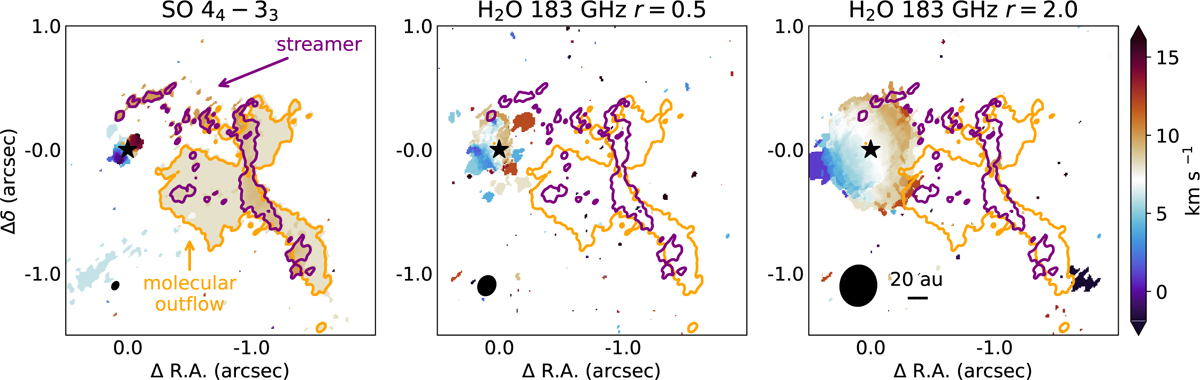
Moment 1 maps of the SO 44–33 transition (left) and the H2O 183 GHz line imaged with a robust parameter of 0.5 (middle) and 2.0 (right). The orange and purple contours indicate the emission above 5σ in the SO channel at 8 and 10 km s−1 tracing primarily the molecular outflow and the streamer, respectively, where 1σ corresponds to 0.3 mJy beam−1. The beam of the respective moment 1 maps is indicated in the bottom-left corner of each panel, and a 20 au scale bar is shown in the right panel.
Current usage metrics show cumulative count of Article Views (full-text article views including HTML views, PDF and ePub downloads, according to the available data) and Abstracts Views on Vision4Press platform.
Data correspond to usage on the plateform after 2015. The current usage metrics is available 48-96 hours after online publication and is updated daily on week days.
Initial download of the metrics may take a while.