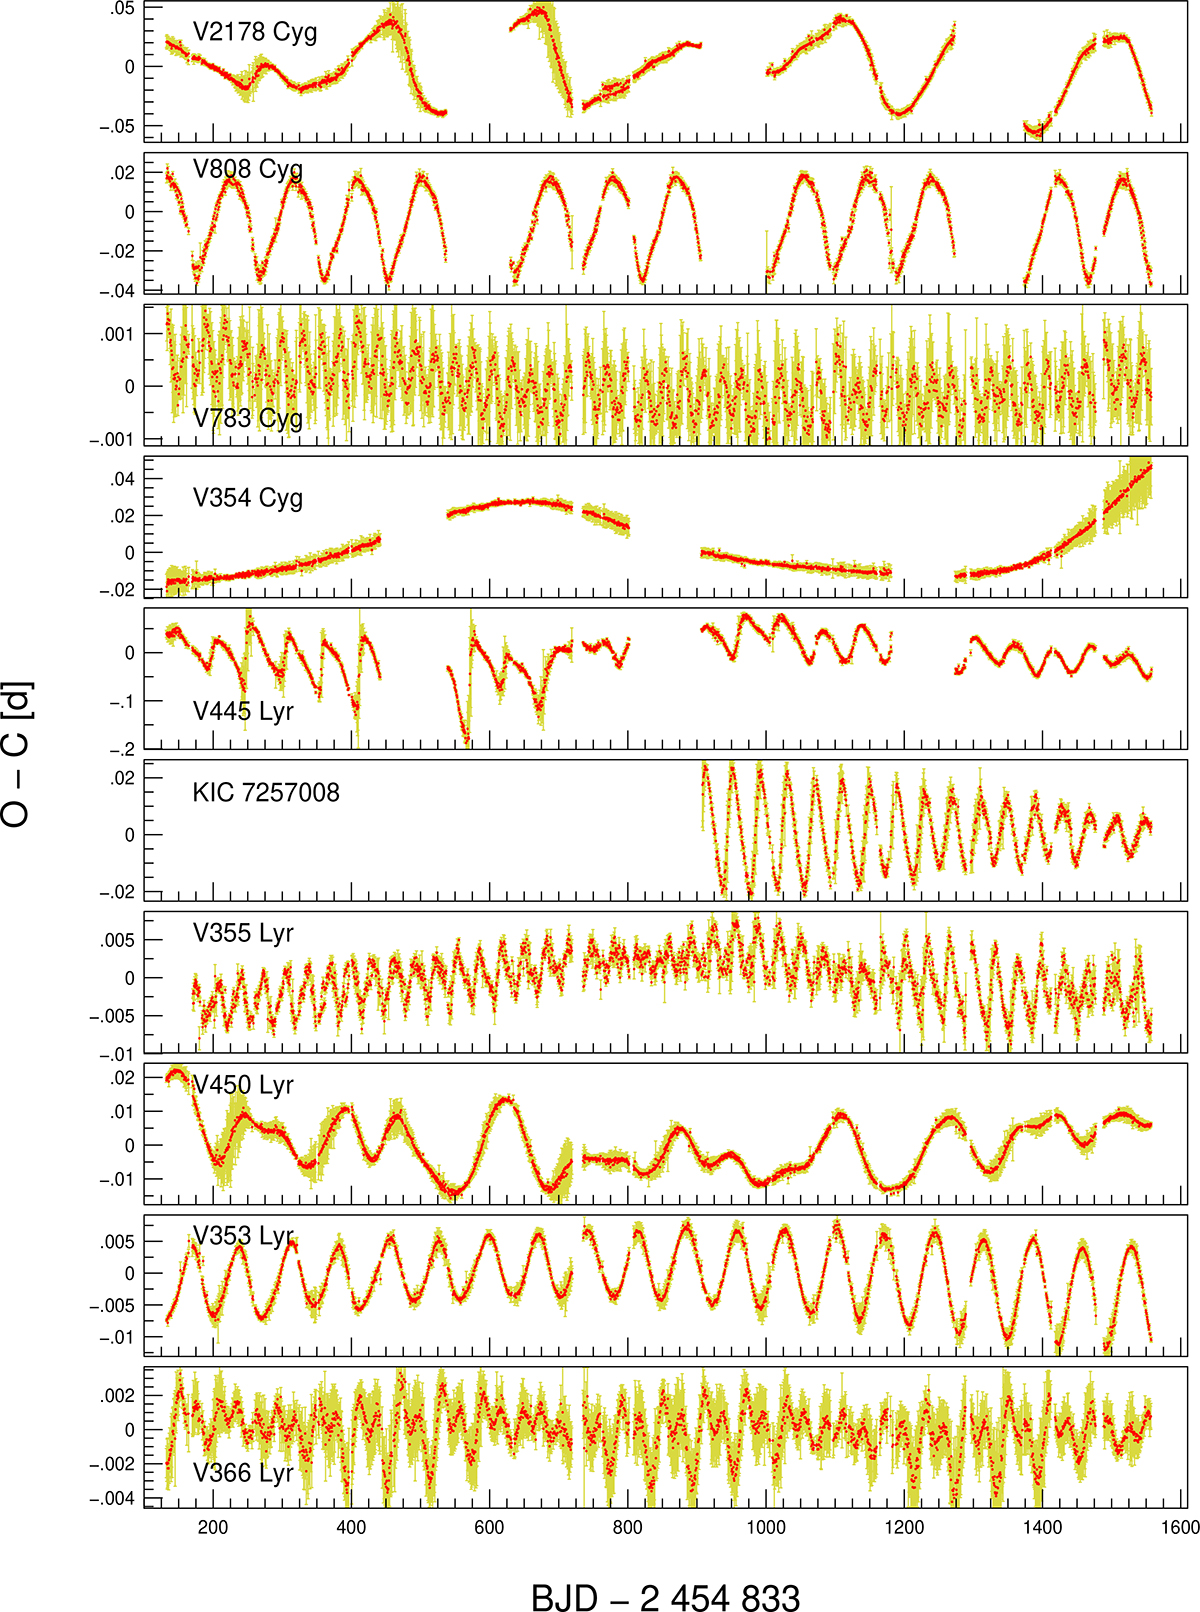
Fig. A.1.
Download original image
O−C diagrams of Kepler Blazhko RR Lyrae stars prepared using the template-fitting method. Red curves represent the main target stars of the Kepler mission, for which the light curves were taken from Benkő et al. (2014). The blue curves represent stars found by Forró et al. (2022) in the background pixels. There can be a difference of four orders of magnitude in the O−C values of individual stars (see vertical scales). The light yellow bars show estimated errors based on a Monte Carlo simulation.
Current usage metrics show cumulative count of Article Views (full-text article views including HTML views, PDF and ePub downloads, according to the available data) and Abstracts Views on Vision4Press platform.
Data correspond to usage on the plateform after 2015. The current usage metrics is available 48-96 hours after online publication and is updated daily on week days.
Initial download of the metrics may take a while.