Fig. 1
Download original image
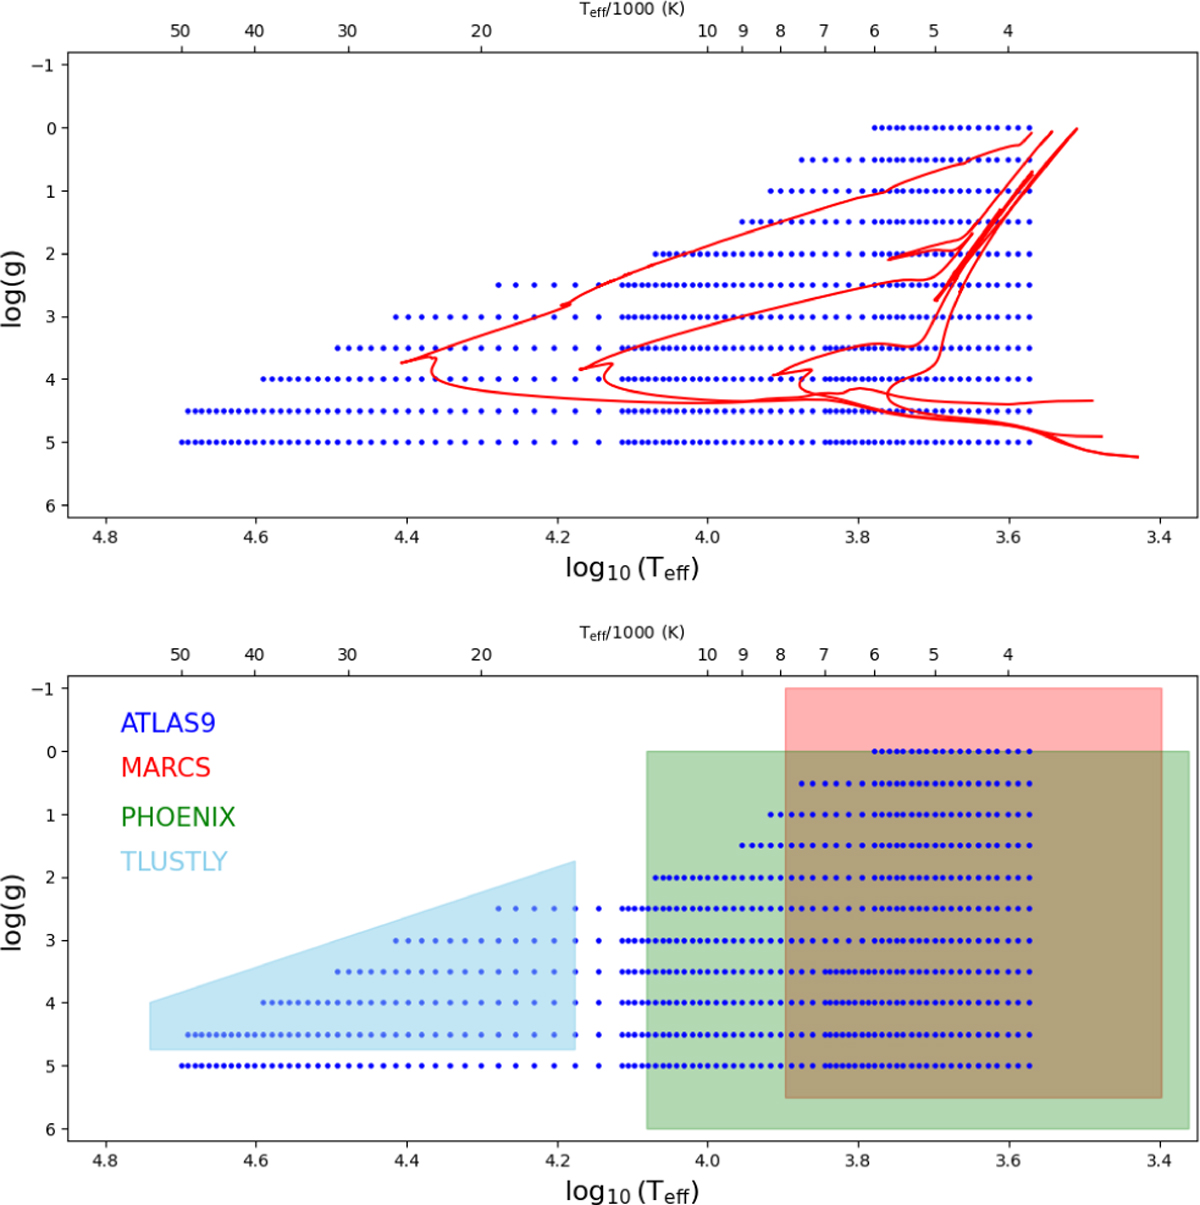
Distribution of the ATLAS9 model atmospheres of the new grid (blue circles) in the log10(Teff)–log g plane superimposed (upper panel) to four theoretical BaSTI-IAC isochrones with 15 Myr, 100 Myr, 1 Gyr, and 13 Gyr and a solar-scaled metallicity (Hidalgo et al. 2018) and compared (lower panel) to the distribution of MARCS (Gustafsson et al. 2008), PHOENIX (Husser et al. 2013), and TLUSTY (Lanz & Hubeny 2003, 2007) model atmospheres.
Current usage metrics show cumulative count of Article Views (full-text article views including HTML views, PDF and ePub downloads, according to the available data) and Abstracts Views on Vision4Press platform.
Data correspond to usage on the plateform after 2015. The current usage metrics is available 48-96 hours after online publication and is updated daily on week days.
Initial download of the metrics may take a while.